plot
Plot 3-D map points and estimated camera trajectory in RGB-D visual SLAM
Since R2024a
Description
plot( plots the 3-D map points and
estimated camera trajectory from the RGB-D visual SLAM object
vslam)vslam.
plot(
specifies options using one or more name-value arguments. For example,
vslam,Name=Value)MarkerSize=10 sets the diameter of the marker size to 10 points.
ax = plot(___)
Examples
Perform RGB-D visual simultaneous localization and mapping (vSLAM) using the data from the TUM RGB-D Benchmark. You can download the data to a temporary directory using a web browser or by running this code:
baseDownloadURL = "https://vision.in.tum.de/rgbd/dataset/freiburg3/rgbd_dataset_freiburg3_long_office_household.tgz";
dataFolder = fullfile(tempdir,"tum_rgbd_dataset",filesep);
options = weboptions(Timeout=Inf);
tgzFileName = dataFolder+"fr3_office.tgz";
folderExists = exist(dataFolder,"dir");

% Create a folder in a temporary directory to save the downloaded file
if ~folderExists
    mkdir(dataFolder)
    disp("Downloading fr3_office.tgz (1.38 GB). This download can take a few minutes.")
    websave(tgzFileName,baseDownloadURL,options);

    % Extract contents of the downloaded file
    disp("Extracting fr3_office.tgz (1.38 GB) ...")
    untar(tgzFileName,dataFolder);
end
Create two imageDatastore objects. One to store the color images and the other to store the depth images.
colorImageFolder = dataFolder+"rgbd_dataset_freiburg3_long_office_household/rgb/";
depthImageFolder = dataFolder+"rgbd_dataset_freiburg3_long_office_household/depth/";

imdsColor = imageDatastore(colorImageFolder);
imdsDepth = imageDatastore(depthImageFolder);
Select the synchronized pair of color and depth images.
data = load("rgbDepthPairs.mat");
imdsColor=subset(imdsColor, data.indexPairs(:, 1));
imdsDepth=subset(imdsDepth, data.indexPairs(:, 2));
Specify your camera intrinsic parameters, and use them to create an RGB-D visual SLAM object.
intrinsics = cameraIntrinsics([535.4 539.2],[320.1 247.6],[480 640]);
depthScaleFactor = 5000;
vslam = rgbdvslam(intrinsics,depthScaleFactor);
Process each pair of color and depth images, and visualize the camera poses and 3-D map points.
for i = 1:numel(imdsColor.Files)
    colorImage = readimage(imdsColor,i);
    depthImage = readimage(imdsDepth,i);
    addFrame(vslam,colorImage,depthImage);

    if hasNewKeyFrame(vslam)
        % Query 3-D map points and camera poses
        xyzPoints = mapPoints(vslam);
        [camPoses,viewIds] = poses(vslam);

        % Display 3-D map points and camera trajectory
        plot(vslam);
    end

    % Get current status of system
    status = checkStatus(vslam);

    % Stop adding frames when tracking is lost
    if status == uint8(0)
        break
    end
end
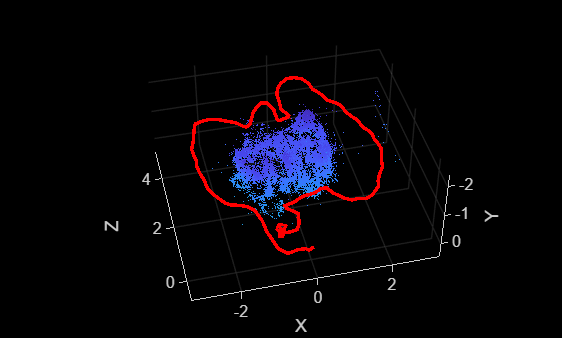
Once all the frames have been processed, reset the system.
while ~isDone(vslam)
    plot(vslam);
end
reset(vslam);
Perform RGB-D visual-inertial SLAM using the data from the OpenLORIS-Scene Dataset. Download the data to a temporary directory using a web browser or by running this code:
dataFolder  = fullfile(tempdir,"OpenLORIS-Scene",filesep);
downloadURL = "https://ssd.mathworks.com/supportfiles/shared_nav_vision/data/OpenLORIS-Scene_corridor1-4.zip";
zipFileName = dataFolder+"corridor1-4.zip";

if ~isfolder(dataFolder)
    mkdir(dataFolder);
    disp("Downloading corridor1-4.zip (1.13 GB). This download can take a few minutes.");
    options = weboptions('Timeout', Inf);
    websave(zipFileName, downloadURL, options);
    unzip(zipFileName, dataFolder);
end
Create two imageDatastore objects. One to store the color images and the other to store the depth images.
imageFolder = fullfile(dataFolder,"OpenLORIS-Scene_corridor1-4");
imdsColor = imageDatastore(fullfile(imageFolder,"color"));
imdsDepth = imageDatastore(fullfile(imageFolder,"aligned_depth"));
Load the IMU measurements data and the camera-to-IMU transform.
data    = load("corridor4_IMU_data.mat");
gyro    = data.gyroDataCell;
accel   = data.accelDataCell;
cam2IMU = data.cam2IMU;
Specify the camera intrinsics, the IMU parameters, and use them to create an RGB-D visual-inertial SLAM object.
% Camera intrinsic and IMU parameters can be found in the downloaded
% sensors.yaml file
intrinsics = cameraIntrinsics([6.1145098876953125e+02, 6.1148571777343750e+02],...
    [4.3320397949218750e+02, 2.4947302246093750e+02], [480, 848]);

imuParams = factorIMUParameters(AccelerometerBiasNoise=2.499999936844688e-05*eye(3),...
       AccelerometerNoise=0.00026780980988405645*eye(3),...
       GyroscopeNoise=1.0296060281689279e-05*eye(3),...
       GyroscopeBiasNoise=2.499999993688107e-07*eye(3),...
       SampleRate=250);

depthScaleFactor = 1000;
vslam = rgbdvslam(intrinsics, depthScaleFactor, imuParams, SkipMaxFrames=10,...
    CameraToIMUTransform=cam2IMU, TrackFeatureRange = [30, 150], DepthRange= [0.1, 6.5], ...
    NumPosesThreshold=20, MaxNumPoints=1.2e3);
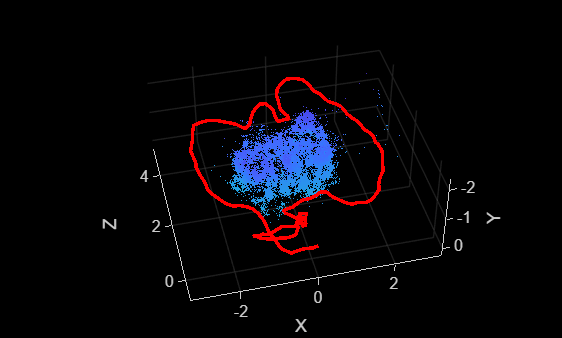
Process image data and IMU data, and visualize the camera poses and 3-D map points. The abrupt changes observed in the camera poses demonstrate that the camera trajectories have been successfully aligned with the IMU predictions, which is an essential step in visual-inertial SLAM. This process transforms the camera poses into the IMU's coordinate system.
for i = 1:numel(imdsColor.Files)
    colorImage  = readimage(imdsColor,i);
    depthImage  = readimage(imdsDepth,i);
    addFrame(vslam, colorImage, depthImage, gyro{i}, accel{i});

    if hasNewKeyFrame(vslam)
        plot(vslam);
    end
end
Once all the frames have been processed, reset the system.
while ~isDone(vslam)
    if hasNewKeyFrame(vslam)
        ax = plot(vslam);
    end
end
view(ax, 0, 90)
reset(vslam);
Input Arguments
Name-Value Arguments
Output Arguments
Version History
Introduced in R2024a
See Also
Objects
Functions
addFrame|hasNewKeyFrame|checkStatus|isDone|mapPoints|poses|reset