mahal
Mahalanobis distance to reference samples
Syntax
Description
d2 = mahal(Y,X)Y to the reference
samples in X.
Examples
Generate a correlated bivariate sample data set.
rng('default') % For reproducibility
X = mvnrnd([0;0],[1 .9;.9 1],1000);
Specify four observations that are equidistant from the mean of X in Euclidean distance.
Y = [1 1;1 -1;-1 1;-1 -1];
Compute the Mahalanobis distance of each observation in Y to the reference samples in X.
d2_mahal = mahal(Y,X)
d2_mahal = 4×1

    1.1095
   20.3632
   19.5939
    1.0137
Compute the squared Euclidean distance of each observation in Y from the mean of X.
d2_Euclidean = sum((Y-mean(X)).^2,2)
d2_Euclidean = 4×1

    2.0931
    2.0399
    1.9625
    1.9094
Plot X and Y by using scatter and use marker color to visualize the Mahalanobis distance of Y to the reference samples in X.
scatter(X(:,1),X(:,2),10,'.') % Scatter plot with points of size 10
hold on
scatter(Y(:,1),Y(:,2),100,d2_mahal,'o','filled')
hb = colorbar;
ylabel(hb,'Mahalanobis Distance')
legend('X','Y','Location','best')
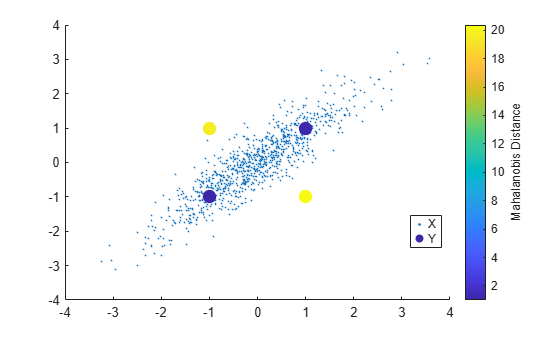
All observations in Y ([1,1], [-1,-1,], [1,-1], and [-1,1]) are equidistant from the mean of X in Euclidean distance. However, [1,1] and [-1,-1] are much closer to X than [1,-1] and [-1,1] in Mahalanobis distance. Because Mahalanobis distance considers the covariance of the data and the scales of the different variables, it is useful for detecting outliers.
Input Arguments
Output Arguments
More About
Tips
Each time you call the
mahalfunction, it computes the covariance matrix of the reference samples. In cases where you want to compute Mahalanobis distances between multiple sets of data and the same reference samplesX, you can save computing time by calculating the covariance matrix ofXonly once, and supplying it to thepdist2function. For an example, see Compute Mahalanobis Distance.
Version History
Introduced before R2006a