kfoldPredict
Predict responses for observations in cross-validated quantile regression model
Since R2025a
Syntax
Description
predictedY = kfoldPredict(CVMdl)CVMdl. For every fold, kfoldPredict predicts the
responses for validation-fold observations using a model trained on training-fold
observations. CVMdl.X and CVMdl.Y contain both sets of
observations.
predictedY = kfoldPredict(CVMdl,Name=Value)
[
additionally returns a matrix predictedY,crossingIndicator] = kfoldPredict(___)crossingIndicator whose entries indicate
whether predictions for the specified quantiles cross each other.
Examples
Create a cross-validated quantile regression model. Compare the predicted response values to the true response values.
Simulate 1000 observations from the model where:
xis a 1000-by-1 vector of evenly spaced values between –10 and 10.is a 1000-by-1 vector of random normal errors with mean 0 and standard deviation 0.2.
rng("default"); % For reproducibility
n = 1000;
x = linspace(-10,10,n)';
y = 1 + 0.05*x + sin(x)./x + 0.2*randn(n,1);
Create a 5-fold cross-validated quantile neural network regression model. Use the default quantile value, which corresponds to the median.
CVMdl = fitrqnet(x,y,KFold=5)
CVMdl =
  RegressionPartitionedQuantileNeuralNetwork
    CrossValidatedModel: 'QuantileNeuralNetwork'
         PredictorNames: {'x1'}
           ResponseName: 'Y'
        NumObservations: 1000
                  KFold: 5
              Partition: [1×1 cvpartition]
      ResponseTransform: 'none'
              Quantiles: 0.5000


  Properties, Methods
CVMdl is a RegressionPartitionedQuantileNeuralNetwork object that contains five trained CompactRegressionQuantileNeuralNetwork model objects (CVMdl.Trained). Each of the five models is trained using approximately 4/5 of the observations in x.
Predict the median response values using the cross-validated quantile regression model. The predicted response values are the predictions on the holdout (validation) observations. In other words, the software obtains each prediction by using a model that was trained without the corresponding observation.
predictedY = kfoldPredict(CVMdl);
Plot the true response values and the predicted response values for the cross-validated model.
plot(x,y,".");
hold on
plot(x,predictedY,".");
xlabel("x")
ylabel("y")
title("Cross-Validation Predictions")
legend(["True","Predicted"])
hold off
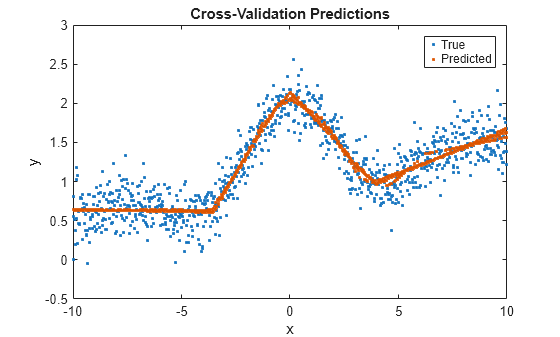
The five CompactRegressionQuantileNeuralNetwork models seem generally to agree, but the predictions differ slightly in the predictor data range from 0 to 10.
You cannot use the cross-validated model directly to make predictions on new data. If you want to predict response values for a new data set, you can train a new quantile regression model using all the data in x and then use the predict object function. For example, predict response values for each even integer between –10 and 10.
Mdl = fitrqnet(x,y);
xnew = (-10:2:10)';
predictedNew = predict(Mdl,xnew)
predictedNew = 11×1

    0.6368
    0.6338
    0.6308
    0.6278
    1.3517
    2.0345
    1.5489
    0.9958
    1.2134
    1.4310
    1.6486
Alternatively, you can use the individual compact models in the Trained property of the cross-validated model and then combine the predictions (for example, through averaging). For example, predict average response values for each even integer between –10 and 10.
predictions = zeros(length(xnew),CVMdl.KFold);
for i = 1:CVMdl.KFold
    predictions(:,i) = predict(CVMdl.Trained{i},xnew);
end
averagePredictions = mean(predictions,2)
averagePredictions = 11×1

    0.6403
    0.6335
    0.6267
    0.6216
    1.3356
    2.0544
    1.5723
    0.9860
    1.2177
    1.4382
    1.6359
Create a cross-validated quantile regression model. Find the test folds that contain observations whose predictions cross each other.
Load the carbig data set, which contains measurements of cars made in the 1970s and early 1980s. Create a table containing the predictor variables Acceleration, Cylinders, Displacement, and so on, as well as the response variable MPG.
load carbig
cars = table(Acceleration,Cylinders,Displacement, ...
    Horsepower,Model_Year,Origin,Weight,MPG);
Categorize the cars based on whether they were made in the USA.
cars.Origin = categorical(cellstr(cars.Origin));
cars.Origin = mergecats(cars.Origin,["France","Japan",...
    "Germany","Sweden","Italy","England"],"NotUSA");
Train a cross-validated quantile neural network regression model. Use the 0.25, 0.50, and 0.75 quantiles (that is, the lower quartile, median, and upper quartile). To improve the model fit, standardize the numeric predictors before training. Use a 3-fold cross-validation.
rng(0,"twister") % For reproducibility
CVMdl = fitrqnet(cars,"MPG",Quantiles=[0.25 0.5 0.75], ...
    Standardize=true,KFold=3);
CVMdl is a RegressionPartitionedQuantileNeuralNetwork object.
Determine if any of the predictions for the quantiles in Mdl.Quantiles cross each other by using kfoldPredict. The crossingIndicator output argument contains a value of 1 (true) for any observation with quantile predictions that cross.
[~,crossingIndicator] = kfoldPredict(CVMdl);
sum(crossingIndicator)
ans =
3
In this example, eight of the observations in cars have quantile predictions that cross each other.
Find the test sets that contain the eight observations.
idx = test(CVMdl.Partition,"all");
observations = idx(crossingIndicator,:)
observations = 3×3 logical array
1 0 0
1 0 0
1 0 0
The majority of the eight observations are in the first test set. Therefore, most of the quantile crossings in CVMdl are produced by the first compact model in the object (CVMdl.Trained{1}), because it provides the predictions for the observations in the first test set.
Input Arguments
Name-Value Arguments
Output Arguments
Algorithms
kfoldPredict computes predictions according to the
predict object function of the trained compact models in
CVMdl (CVMdl.Trained). For more information, see the
model-specific predict function reference pages in the following
table.
| Model Type | predict Function |
|---|---|
| Quantile linear regression model | predict |
| Quantile neural network model for regression | predict |
Version History
Introduced in R2025a