kfoldPredict
Classify observations in cross-validated classification model
Syntax
Description
label = kfoldPredict(CVMdl,'IncludeInteractions',includeInteractions)
Examples
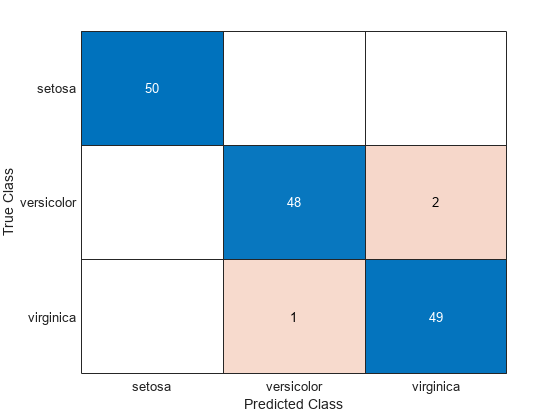
Create a confusion matrix using the 10-fold cross-validation predictions of a discriminant analysis model.
Load the fisheriris data set. X contains flower measurements for 150 different flowers, and y lists the species, or class, for each flower. Create a variable order that specifies the order of the classes.
load fisheriris
X = meas;
y = species;
order = unique(y)
order = 3×1 cell
{'setosa' }
{'versicolor'}
{'virginica' }
Create a 10-fold cross-validated discriminant analysis model by using the fitcdiscr function. By default, fitcdiscr ensures that training and test sets have roughly the same proportions of flower species. Specify the order of the flower classes.
cvmdl = fitcdiscr(X,y,'KFold',10,'ClassNames',order);
Predict the species of the test set flowers.
predictedSpecies = kfoldPredict(cvmdl);
Create a confusion matrix that compares the true class values to the predicted class values.
confusionchart(y,predictedSpecies)
Find the cross-validation predictions for a model based on Fisher's iris data.
Load Fisher's iris data set.
load fisheririsTrain an ensemble of classification trees using AdaBoostM2. Specify tree stumps as the weak learners.
rng(1); % For reproducibility
t = templateTree('MaxNumSplits',1);
Mdl = fitcensemble(meas,species,'Method','AdaBoostM2','Learners',t);
Cross-validate the trained ensemble using 10-fold cross-validation.
CVMdl = crossval(Mdl);
Estimate cross-validation predicted labels and scores.
[elabel,escore] = kfoldPredict(CVMdl);
Display the maximum and minimum scores of each class.
max(escore)
ans = 1×3

    9.3862    8.9871   10.1866
min(escore)
ans = 1×3

    0.0018    3.8359    0.9573
Compute the loss and the predictions for a classification model, first partitioned using holdout validation and then partitioned using 3-fold cross-validation. Compare the two sets of losses and predictions.
Create a table from the fisheriris data set, which contains length and width measurements from the sepals and petals of three species of iris flowers. View the first eight observations.
fisheriris = readtable("fisheriris.csv");
head(fisheriris)
SepalLength SepalWidth PetalLength PetalWidth Species
___________ __________ ___________ __________ __________
5.1 3.5 1.4 0.2 {'setosa'}
4.9 3 1.4 0.2 {'setosa'}
4.7 3.2 1.3 0.2 {'setosa'}
4.6 3.1 1.5 0.2 {'setosa'}
5 3.6 1.4 0.2 {'setosa'}
5.4 3.9 1.7 0.4 {'setosa'}
4.6 3.4 1.4 0.3 {'setosa'}
5 3.4 1.5 0.2 {'setosa'}
Partition the data using cvpartition. First, create a partition for holdout validation, using approximately 70% of the observations for the training data and 30% for the validation data. Then, create a partition for 3-fold cross-validation.
rng(0,"twister") % For reproducibility
holdoutPartition = cvpartition(fisheriris.Species,Holdout=0.30);
kfoldPartition = cvpartition(fisheriris.Species,KFold=3);
holdoutPartition and kfoldPartition are both stratified random partitions. You can use the training and test functions to find the indices for the observations in the training and validation sets, respectively.
Train a classification tree model using the fisheriris data. Specify Species as the response variable.
Mdl = fitctree(fisheriris,"Species");Create the partitioned classification models using crossval.
holdoutMdl = crossval(Mdl,CVPartition=holdoutPartition)
holdoutMdl =
  ClassificationPartitionedModel
    CrossValidatedModel: 'Tree'
         PredictorNames: {'SepalLength'  'SepalWidth'  'PetalLength'  'PetalWidth'}
           ResponseName: 'Species'
        NumObservations: 150
                  KFold: 1
              Partition: [1×1 cvpartition]
             ClassNames: {'setosa'  'versicolor'  'virginica'}
         ScoreTransform: 'none'


  Properties, Methods
kfoldMdl = crossval(Mdl,CVPartition=kfoldPartition)
kfoldMdl =
  ClassificationPartitionedModel
    CrossValidatedModel: 'Tree'
         PredictorNames: {'SepalLength'  'SepalWidth'  'PetalLength'  'PetalWidth'}
           ResponseName: 'Species'
        NumObservations: 150
                  KFold: 3
              Partition: [1×1 cvpartition]
             ClassNames: {'setosa'  'versicolor'  'virginica'}
         ScoreTransform: 'none'


  Properties, Methods
holdoutMdl and kfoldMdl are ClassificationPartitionedModel objects.
Compute the minimal expected misclassification cost for holdoutMdl and kfoldMdl using kfoldLoss. Because both models use the default cost matrix, this cost is the same as the classification error.
holdoutL = kfoldLoss(holdoutMdl)
holdoutL =
0.0889
kfoldL = kfoldLoss(kfoldMdl)
kfoldL =
0.0600
holdoutL is the error computed using the predictions for one validation set, while kfoldL is an average error computed using the predictions for three folds of validation data. Cross-validation metrics tend to be better indicators of a model's performance on unseen data.
Compute the validation data predictions for the two models using kfoldPredict.
[holdoutLabels,holdoutScores] = kfoldPredict(holdoutMdl);
[kfoldLabels,kfoldScores] = kfoldPredict(kfoldMdl);

holdoutClassNames = holdoutMdl.ClassNames;
holdoutScores = array2table(holdoutScores,VariableNames=holdoutClassNames);
kfoldClassNames = kfoldMdl.ClassNames;
kfoldScores = array2table(kfoldScores,VariableNames=kfoldClassNames);

predictions = table(holdoutLabels,kfoldLabels, ...
    holdoutScores,kfoldScores, ...
    VariableNames=["holdoutMdl Labels","kfoldMdl Labels", ...
    "holdoutMdl Scores","kfoldMdl Scores"])
predictions=150×4 table
    holdoutMdl Labels    kfoldMdl Labels            holdoutMdl Scores                     kfoldMdl Scores
    _________________    _______________    _________________________________    _________________________________

                                            setosa    versicolor    virginica    setosa    versicolor    virginica
                                            ______    __________    _________    ______    __________    _________

       {'setosa'}          {'setosa'}        NaN         NaN           NaN         1           0             0
       {'setosa'}          {'setosa'}          1           0             0         1           0             0
       {'setosa'}          {'setosa'}        NaN         NaN           NaN         1           0             0
       {'setosa'}          {'setosa'}        NaN         NaN           NaN         1           0             0
       {'setosa'}          {'setosa'}        NaN         NaN           NaN         1           0             0
       {'setosa'}          {'setosa'}        NaN         NaN           NaN         1           0             0
       {'setosa'}          {'setosa'}        NaN         NaN           NaN         1           0             0
       {'setosa'}          {'setosa'}        NaN         NaN           NaN         1           0             0
       {'setosa'}          {'setosa'}        NaN         NaN           NaN         1           0             0
       {'setosa'}          {'setosa'}        NaN         NaN           NaN         1           0             0
       {'setosa'}          {'setosa'}          1           0             0         1           0             0
       {'setosa'}          {'setosa'}        NaN         NaN           NaN         1           0             0
       {'setosa'}          {'setosa'}        NaN         NaN           NaN         1           0             0
       {'setosa'}          {'setosa'}          1           0             0         1           0             0
       {'setosa'}          {'setosa'}          1           0             0         1           0             0
       {'setosa'}          {'setosa'}        NaN         NaN           NaN         1           0             0
      ⋮
kfoldPredict returns NaN scores for the observations used to train holdoutMdl.Trained. For these observations, the function selects the class label with the highest frequency as the predicted label. In this case, because all classes have the same frequency, the function selects the first class (setosa) as the predicted label. The function uses the trained model to return predictions for the validation set observations. kfoldPredict returns each kfoldMdl prediction using the model in kfoldMdl.Trained that was trained without that observation.
To predict responses for unseen data, use the model trained on the entire data set (Mdl) and its predict function rather than a partitioned model such as holdoutMdl or kfoldMdl.
Input Arguments
Output Arguments
Algorithms
kfoldPredict computes predictions as described in the corresponding
predict object function. For a model-specific description, see the
appropriate predict function reference page in the following
table.
| Model Type | predict Function |
|---|---|
| Discriminant analysis classifier | predict |
| Ensemble classifier | predict |
| Generalized additive model classifier | predict |
| k-nearest neighbor classifier | predict |
| Naive Bayes classifier | predict |
| Neural network classifier | predict |
| Support vector machine classifier | predict |
| Binary decision tree for multiclass classification | predict |
Extended Capabilities
Version History
Introduced in R2011aSee Also
ClassificationPartitionedModel | kfoldEdge | kfoldMargin | kfoldLoss | kfoldfun