View State Activity by Using the Simulation Data Inspector
You can use the Simulation Data Inspector (Simulink) to view logged data for your Stateflow® chart. With the Simulation Data Inspector, you can view:
Data from your chart
Child and leaf state activity for your chart
Self, child, and leaf state activity for your states
Add Signals and States for Logging
In this example, you use the Simulation Data Inspector to monitor the active state
data for the Stateflow chart in the model sf_car.
Open the model
sf_car.openExample("sf_car")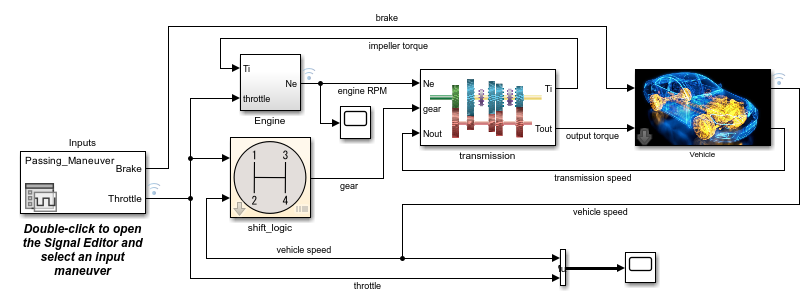
Open the
shift_logicchart by clicking the arrow in the bottom-left corner of the block.
Select the state
gear_state. Then, in the Simulation tab, click Log Child Activity to log which substates ingear_stateare active or inactive at the end of each time step. The logging badge appears in the corner of the
state.
appears in the corner of the
state.In the
selection_statestate, select thedownshiftingsubstate. Then, in the Simulation tab, click Log Self Activity. This selection logs whetherdownshiftingis active or inactive at the end of each time step.Repeat the previous step for the
upshiftingsubstate.
View Logged Output in Simulation Data Inspector
Simulate the model.
In the Simulation tab, under Review Results, select Data Inspector
 . When you simulate the model, the icon
changes color to indicate that the Simulation Data Inspector has new
simulation data.
. When you simulate the model, the icon
changes color to indicate that the Simulation Data Inspector has new
simulation data.In the Simulation Data Inspector, click the Visualizations and layouts button
 . In the Grid
section, change Rows to
. In the Grid
section, change Rows to 3. Then, in the Inspect pane, select a signal for each plot. For more information, see Inspect Simulation Data (Simulink).
See Also
Simulation Data Inspector (Simulink)