Log String Data to the Simulation Data Inspector
This example shows how to build a Stateflow® chart that, based on numeric input data, concatenates string data into natural language output text. You can view the output text in the Simulation Data Inspector and the MATLAB® workspace. For more information about string data, see Manage Textual Information by Using Strings.
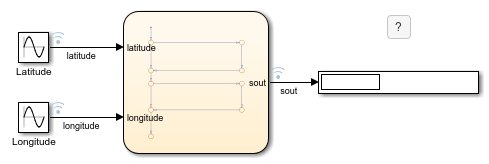
The model in this example uses Sine Wave blocks to provide the latitude and longitude of a point moving along a closed path. The Sine Wave blocks have an amplitude of 50, a bias of 0, and a frequency of 1. The Latitude block has a phase of 0, while the Longitude block has a phase of  .
.
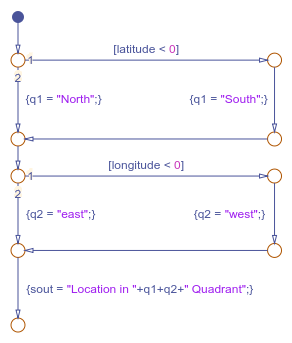
The chart examines these coordinates and assigns the strings q1 and q2 according to these rules:
If
latitudeandlongitudeare positive,q1 = "North"andq2 = "east".If
latitudeis positive andlongitudeis negative,q1 = "North"andq2 = "west".If
latitudeis negative andlongitudeis positive,q1 = "South"andq2 = "east".If
longitudeandlongitudeare negative,q1 = "South"andq2 = "west".
Then, the chart concatenates these strings into an output string sout.
View Simulation Results
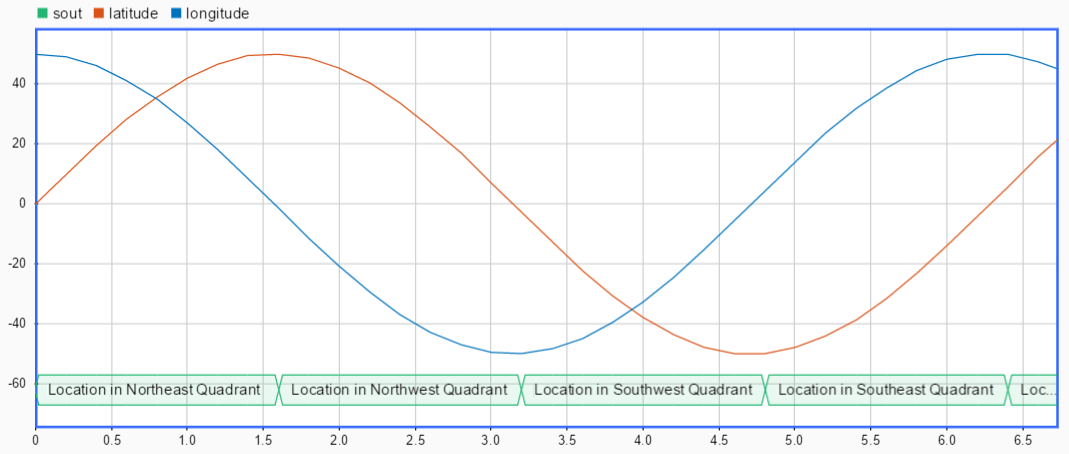
During simulation, the model logs the signals coming into and out of the chart.
To examine the results of the simulation, open the Simulation Data Inspector and select the check boxes for the latitude, longitude, and sout signals. The latitude and longitude signals appear as sinusoidal curves. The sout signal appears as a transition plot. The transition plot displays the value of the string inside a band in which criss-crossed lines mark the changes in value.
To access the logged data in the MATLAB workspace, call the signal logging object logsout. Stateflow exports the string data sout as a MATLAB string scalar. For example, at the command prompt, enter:
Table = table(logsout.get("latitude").Values.Data, ...
    logsout.get("longitude").Values.Data, ...
    logsout.get("sout").Values.Data);
Table.Properties.VariableNames = ...
    ["Latitude","Longitude","QuadrantInfo"];
Table([4:8:30],:)
ans =

  4x3 table

    Latitude    Longitude              QuadrantInfo
    ________    _________    ________________________________

     28.232       41.267     "Location in Northeast Quadrant"
     40.425      -29.425     "Location in Northwest Quadrant"
    -30.593      -39.548     "Location in Southwest Quadrant"
    -38.638       31.735     "Location in Southeast Quadrant"
For more information on logging chart data, see Log Simulation Output for States and Data.
See Also
Related Topics
Select a Web Site
Choose a web site to get translated content where available and see local events and offers. Based on your location, we recommend that you select: United States.
You can also select a web site from the following list
Americas
- América Latina (Español)
- Canada (English)
- United States (English)
Europe
- Belgium (English)
- Denmark (English)
- Deutschland (Deutsch)
- España (Español)
- Finland (English)
- France (Français)
- Ireland (English)
- Italia (Italiano)
- Luxembourg (English)
- Netherlands (English)
- Norway (English)
- Österreich (Deutsch)
- Portugal (English)
- Sweden (English)
- Switzerland
- United Kingdom (English)
Asia Pacific
- Australia (English)
- India (English)
- New Zealand (English)
- 中国
- 日本Japanese (日本語)
- 한국Korean (한국어)