Use Active State Output to Debug Charts
Bugs in Stateflow® can be difficult to identify, diagnose, and fix. By tracking how data and states in your chart change over time, you can understand why bugs occur.
In this example, you debug the control logic for a chemical tank by logging the active state of a subchart and using breakpoints to step through the simulation.
Open the Model
This example models a chemical tank in an assembly line.
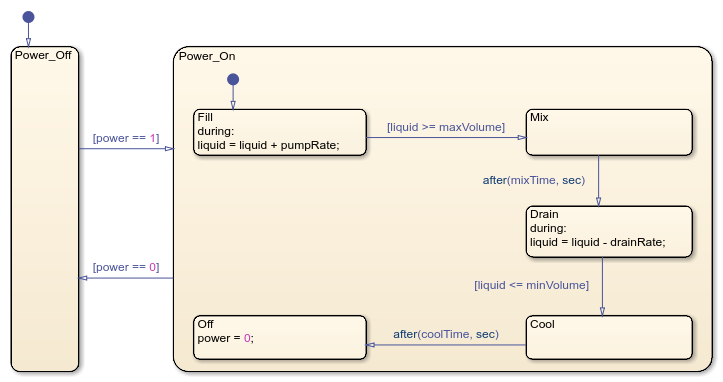
The project requirements state the model must execute these steps:
When the power turns on, liquid begins to fill the tank.
When the volume of the liquid exceeds
maxVolume, the tank mixes the liquid.After mixing for
mixTimeseconds, the liquid drains from the tank.The tank cools for
coolTimeseconds.The tank automatically shuts off.
However, when you simulate the model, the chart never returns to the Power_Off state.
Identify the Problem
Because the chart never returns to the Power_Off state, the error in
the chart must occur in the Power_On state. Determine where the error
occurs by plotting the active child state in the Simulation Data Inspector.
Open the chart.
Select the
Power_Onstate. In the Simulation tab, click Log Child Activity. The logging badge appears in the lower-left corner of
Power_On.Simulate the model.
In the Simulation tab, in the Review Results section, click Data Inspector
 .
.Select Power_On:ActiveChild. Simulation Data Inspector plots the active child state of
Power_Onagainst the simulation time.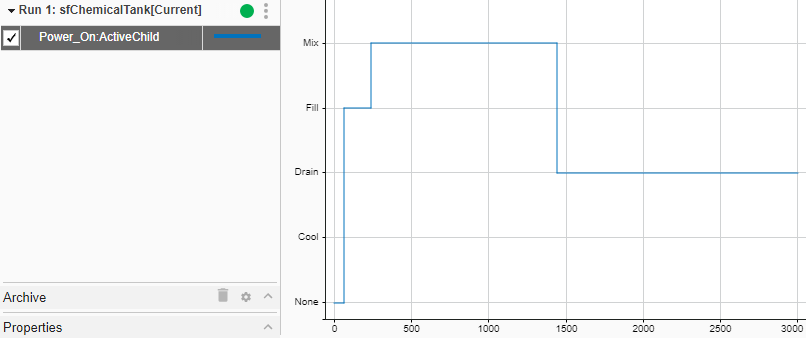
The plot shows that the simulation reaches the Drain child state, but
never progresses beyond it.
Identify the Cause
Now that you have identified where the bug occurs, use breakpoints to determine the cause.
Right-click the
Drainstate and click Set Breakpoint. The breakpoint displays as a red circle in the bottom-left corner ofDrain.Click the breakpoint and clear
On State Entry.Simulate the model.
When the simulation pauses at the breakpoint, point to the
Drainstate. The Data information window displays the values ofdrainRateandliquidas -1770 and 4536.
Click Continue to resume the simulation. At the next breakpoint, the values are -1770 and 6306.
Click Stop Debugging to end the simulation.
The value of liquid increases rather than decreases. Therefore,
liquid never reaches 0, and the chart does not continue to the next
state.
Fix the Bug
The value of liquid continually increases because the
drainRate state has a negative value. To fix the issue, assign a
positive value to drainRate.
In the Modeling tab, click Symbols Pane.
In the Symbols pane, delete the negative sign in the value of
drainRate.Right-click the
Drainstate and click Clear Breakpoint to remove the breakpoint.In the Debug tab, under Animation Speed, select "Medium".
Simulate the model. Before the simulation stops, the chart returns to the
Power_Offstate.Select the
Power_Onstate. In the Simulation tab, click Log Child Activity to turn off active state logging.