Control Chart Execution After a Breakpoint
When the simulation of a Stateflow® chart pauses at a breakpoint, the chart enters debugging mode. You can examine the state of the chart and step through the simulation. For more information, see Set Breakpoints to Debug Charts.
Examine the State of the Chart
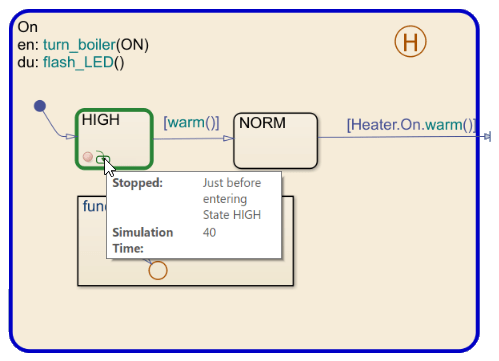
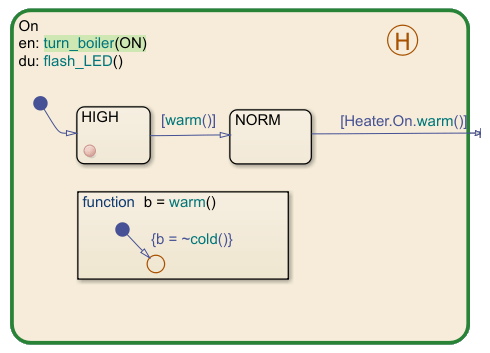
When a Stateflow chart enters debugging mode, the editor highlights the active elements in blue
and the currently executing object in green. For example, this chart is paused at an
entry breakpoint in the HIGH state. The active state
(On) is highlighted in blue and the currently executing substate
(HIGH) is highlighted in green.

An execution status badge appears in the graphical object where the simulation is paused.
| Badge | Description |
|---|---|
| Simulation is paused before entering a chart or in a state
entry action. |
| Simulation is paused in a state during action, graphical
function, or truth table function. |
| Simulation is paused in a state exit action. |
| Simulation is paused before testing a transition. |
| Simulation is paused before taking a valid transition. |
To see the execution status, point to the badge. A tooltip indicates:
Where the simulation is paused
The simulation time
The current event (if the simulation is paused during a local or input event)
To view the values of chart, point to a chart object. A tooltip displays:
The values of the data and messages that the selected object uses
Temporal information (if the object contains a temporal logic operator)
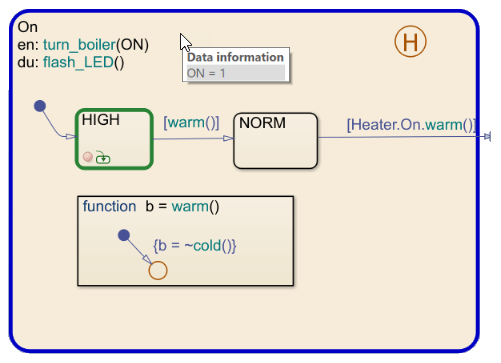
For more information, see Inspect and Modify Data and Messages While Debugging.
Step Through the Simulation
When the chart is paused at a breakpoint, you can continue the simulation by using:
Buttons in the Debug tab
The MATLAB® Command Window
Keyboard shortcuts
| Action | Debug Tab Button | MATLAB Command | Keyboard Shortcut | Description |
|---|---|---|---|---|
| Continue |
| dbcont | Ctrl+T | Continue simulation to the next breakpoint. |
| Step Forward |
| Exit debug mode and pause simulation before next time step. | ||
| Step Over |
| dbstep | F10 | Advance to the next step in the chart execution. At the chart level, possible steps include:
For more information, see Execution of a Stateflow Chart. |
| Step In |
| dbstep in | F11 | From a state or transition action that calls a function, advance to the first executable statement in the function. From a statement in a function containing another function call, advance to the first executable statement in the second function. Otherwise, advance to the next step in the chart execution. (See Step Over.) |
| Step Out |
| dbstep out | Shift+F11 | From a function call, return to the statement calling the function. Otherwise, continue simulation to the next breakpoint. (See Continue.) |
| Run to Cursor |
| In state or transition actions containing more than one statement, execute a group of statements together. | ||
| Stop |
| dbquit | Ctrl+Shift+T | Exit debug mode and stop simulation. |
In state or transition actions that contain more than one statement, you can step through the individual statements one at a time by selecting Step Over. The Stateflow Editor highlights each statement before executing it.
To execute a group of statements together, click the last statement in the group and select Run to Cursor.