Stateflow Editor Operations
Stateflow Editor
The Stateflow® Editor allows you to draw, zoom, modify, print, and save a Stateflow chart in your Simulink® model. When you open a new Stateflow chart, the Stateflow Editor displays the chart.
To open a Stateflow chart in the Stateflow Editor:
Create a new Stateflow chart using the
sfnewfunction. The table summarizes syntaxes to create new Stateflow charts with MATLAB or C as the action language.Command Result sfnew
Creates an empty chart with MATLAB® as the action language. sfnew -C
Creates an empty chart with C as the action language. The Simulink Editor opens, and an empty chart is included on the canvas.
To open the Stateflow Editor, double-click the chart.

The main components of the Stateflow Editor are the chart canvas, the object palette, the Symbols pane, and the Property Inspector.
The chart canvas is a drawing area where you create a chart by combining states, transitions, and other graphical elements.
On the left side of the canvas, the object palette displays a set of tools for adding graphical elements to your chart. For more information, see Graphical Objects.
To add an object:
Click the icon for the object and move the cursor to the spot in the drawing area where you want to place the object.
Drag the icon for the object into the drawing area.
Double-click the icon and then click multiple times in the drawing area to make copies of the object.
On the right side of the canvas, in the Symbols pane, you add new data to the chart and resolve any undefined or unused symbols. Also on the right side of the canvas, above the Symbols pane, is the Property Inspector. Use the Property Inspector to change the properties for symbols listed in the Symbols pane. For more information, see Stateflow Editor.
Undo and Redo Editor Operations
You can undo and redo operations that you perform in a chart. When you undo an operation, you reverse the last edit operation that you performed. After you undo operations in the chart, you can also redo them one at a time.
To undo an operation in the chart, press Ctrl + Z.
To redo an operation in the chart, press Ctrl + Y.
Exceptions for Undo
You can undo or redo all editor operations, with the following exceptions:
You cannot undo the operation of turning subcharting off for a state previously subcharted.
For more information about subcharting, see Encapsulate Modal Logic by Using Subcharts.
You cannot undo the drawing of a supertransition or the splitting of an existing transition.
Splitting of an existing transition refers to the redirection of the source or destination of a transition segment that is part of a supertransition. For more information about supertransitions, see Create a Supertransition That Enters a Subchart and Create a Supertransition That Exits a Subchart.
You cannot undo any changes made to the chart using the Stateflow API.
For more information about the Stateflow API, see Stateflow Programmatic Interface.
Specify Colors and Fonts in a Chart
You can change the way Stateflow displays an individual element of a chart or specify the global display options used throughout the entire chart.
Change Size of a Single Element
To change the display size for a single element in the chart, right-click the element, and then select a new Format option from the context menu. The options available depend on the element that you select.
| Option | States | Transitions | Junctions | Annotations | Other Elements |
|---|---|---|---|---|---|
| Font Size | Available | Available | Not Available | Available | Available |
| Arrowhead Size | Available | Available | Available | Not Available | Not Available |
| Junction Size | Not Available | Not Available | Available | Not Available | Not Available |
| Font Style | Not Available | Not Available | Not Available | Available | Not Available |
| Shadow | Not Available | Not Available | Not Available | Available | Not Available |
| Text Alignment | Not Available | Not Available | Not Available | Available | Not Available |
Change Global Display Options
Through the Colors & Fonts dialog box, you can specify a color scheme for the chart or specify colors and label fonts for different types of objects in a chart. To open the Colors & Fonts dialog box, in the Format tab, click Style.

In the Colors & Fonts dialog box, the drawing area displays examples of the colors and label fonts specified by the current color scheme for the chart. You can choose a different color scheme from the Schemes menu. To modify the display options for a single type of chart element, position your pointer over the sample object.
To change the color of the element, click the sample object and select a new color in the dialog box.
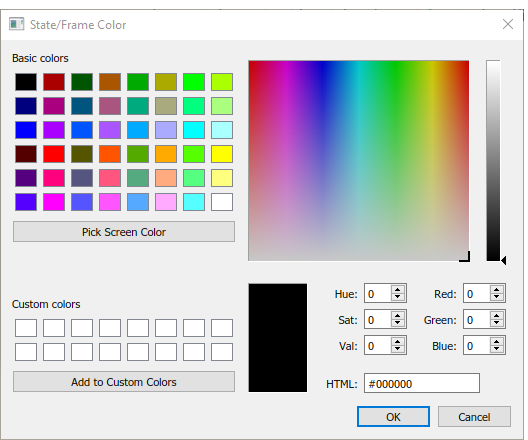
To change the font of the element, right-click the sample object and select a new font, style, or size in the dialog box.

To apply the scheme to the chart, click Apply. To apply the scheme and close the dialog box, click OK.
To make the scheme the default scheme for all charts, select Options > Make this the 'Default' scheme.
To save changes to the default color scheme, select Options > Save defaults to disk. If the modified scheme is not the default scheme, choosing Save defaults to disk has no effect.
Content Preview for Stateflow Objects
When a chart is closed, you can preview the content of Stateflow charts in Simulink. You can see an outline of the contents of a chart. During simulation, you can see chart animation. When a chart is open, you can preview the content of subcharts and Simulink functions.
To turn on content preview for Stateflow charts and subcharts, right-click the chart and select Format > Content Preview. For Simulink functions, right-click the function and select Content Preview. For details on content preview in Simulink, see Preview Content of Model Components (Simulink).
For example, the Temporal Logic chart uses content preview. The
chart Without Temporal Logic does not.

Intelligent Tab Completion for Stateflow Charts
Stateflow tab completion provides context-sensitive editing assistance. Tab completion helps you avoid typographical errors. It also helps you quickly select syntax-appropriate options for keywords, data, event, messages, and function names, without having to navigate the Model Explorer. In a Stateflow chart, to complete entries:
Type the first few characters of the word that you want.
Press Tab to see the list of possible matches.
Use the arrow keys to select a word.
Press Tab to make the selection.
Additionally, you can:
Close the list without selecting anything by pressing the Esc key.
Type additional characters onto your original term to narrow the list of possible matches.
If you press Tab and no words are listed, then the current word is the only possible match.
Differentiate Elements of Action Language Syntax
You can use color highlighting to differentiate the following syntax elements:
Keywords
Comments
Events
Messages
Functions
Strings
Numbers
Local data
Constant data
Input data
Output data
Parameter data
Data Store Memory data
Syntax highlighting is a user preference, not a model preference.
Default Syntax Highlighting
The following chart illustrates the default highlighting with the Enable data syntax highlighting option enabled.

If the Stateflow parser cannot resolve a syntax element, the chart displays the element in the default text color.
Edit Syntax Highlighting
In the Stateflow Editor, in the Format tab, click Style > Syntax Highlighting. The Syntax Highlight Preferences dialog box appears.

To reset highlighting colors to their default, select Reset Colors, and click Apply. Alternatively, you can reset the default colors with
Stateflow.resetSyntaxHighlightingColors.To disable or enable highlighting, select or clear Enable syntax highlighting.
To change a color, in the Syntax Highlight Preferences dialog box, select a color to change. Choose an alternative from the color palette, and click Apply.
To close the Syntax Highlight Preferences dialog box, click OK.
Zoom and Navigate with the Miniature Map
To zoom in or out of a Stateflow chart, use the scroll wheel on your mouse. When you zoom Press and hold Space to see a dialog with the keyboard shortcuts.

You can also press Space to view a miniature map of your chart in the bottom-left corner. As you zoom or navigate within your Stateflow chart, the blue square will move on the miniature map, indicating your location relative to the entire chart.

You can also click and drag the blue square on the miniature map to navigate within your Stateflow chart. As you zoom out, the text in your Stateflow chart adjusts its size to maintain readability.

Format Chart Objects
To enhance readability of objects in a chart, in the Stateflow Editor you can use commands in the Format tab. These commands include options for:
Alignment
Distribution
Resizing
You can align, distribute, or resize these chart objects:
States
Functions
Boxes
Junctions
Some of these options appear only after selecting elements within your chart.
Align, Distribute, and Resize Chart Objects
The basic steps to align, distribute, or resize chart objects are similar.
Select the chart objects that you want to align, distribute, or resize.
You can select objects in any order, one-by-one, or by drawing a box around them.
Decide which object to use as the anchor for aligning, distributing, or resizing other chart objects. This object is the reference object.
To set an object as the reference, right-click the object. Brackets appear around the reference object. In the following example, the
DoorandMotionstates are selected, and theDoorstate is the reference. If you select objects one-by-one, the last object that you select acts as the reference.
Select an option from the Format tab to align, distribute, or resize your chosen objects.
For more information about chart object distribution options, see Options for Distributing Chart Objects
Options for Distributing Chart Objects
| Option | Description |
|---|---|
| Distribute Horizontally | The center-to-center horizontal distance between any two objects is the same. The horizontal space for distribution is the distance between the left edge of the leftmost object and the right edge of the rightmost object. If the total width of the objects you select exceeds the horizontal space available, objects can overlap after distribution. |
| Distribute Vertically | The center-to-center vertical distance between any two objects is the same. The vertical space for distribution is the distance between the top edge of the highest object and the bottom edge of the lowest object. If the total height of the objects you select exceeds the vertical space available, objects can overlap after distribution. |
| Even Horizontal Gaps | The horizontal white space between any two objects is the same. The space restriction for Distribute Horizontally applies. |
| Even Vertical Gaps | The vertical white space between any two objects is the same. The space restriction for Distribute Vertically applies. |
Automatic Chart Formatting
With Arrange Automatically, Stateflow arranges your charts to:
Expand states and transitions to fit their label strings.
Resize similar states to be the same size.
Align states if they were slightly misaligned.
Straightens transitions.
Repositions horizontal transition labels to the midpoint.
In the Format tab, click Auto Arrange.
In this example, the chart has:
State actions that are outside of the boundary for state A.
A transition condition that overlaps state B.
A transition that is not horizontal.
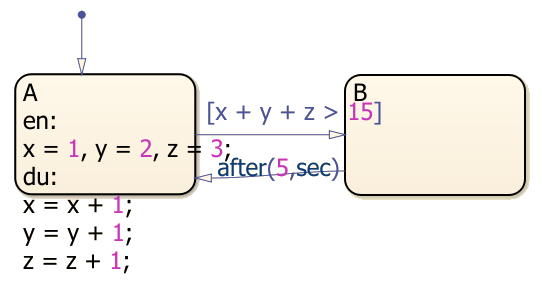
After the layout has been automatically arranged:
The state actions are contained within state A.
The transition condition does not overlap into state B.
The lower transition is horizontal.

Parse Syntax Errors
To parse syntax errors in a chart, state transition table, or truth table, compile the model. In the Modeling tab, select Update Model.