Debug a Standalone Stateflow Chart
A standalone Stateflow® chart is a MATLAB® class that defines the behavior of a finite state machine. Standalone charts implement classic chart semantics with MATLAB as the action language. You can program the chart by using the full functionality of MATLAB, including those functions that are restricted for code generation in Simulink®. For more information, see Create Stateflow Charts for Execution as MATLAB Objects.
To enable debugging, set a breakpoint in the standalone chart or in a MATLAB script that executes the chart. Breakpoints pause the execution of a chart. While the execution is paused, you can step through each action in the chart, view data values, and interact with the MATLAB workspace to examine the state of the chart.
Note
When debugging a standalone chart that you execute from a MATLAB script, first open the Stateflow Editor. Attempting to debug a standalone chart before opening the editor at least once can produce unexpected results.
For information on debugging Stateflow charts in Simulink models, see Set Breakpoints to Debug Charts.
Set and Clear Breakpoints
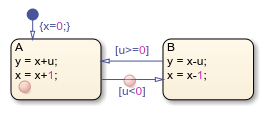
Breakpoints appear as circular red badges. For example, this chart contains
breakpoints on the state A and on the transition from
A to B.
You can set breakpoints on charts, states, and transitions.
Breakpoints on Charts
To set a breakpoint on a chart, right-click inside the chart and select Set Breakpoint on Chart Entry. This type of breakpoint pauses the execution before entering the chart.
To remove the breakpoint, right-click inside the chart and clear the Set Breakpoint on Chart Entry option.
Breakpoints on States and Transitions
You can set different types of breakpoints on states and transitions.
| Object | Breakpoint Type |
|---|---|
| State |
|
| |
| |
| Transition |
|
|
To set a breakpoint on a state or transition, right-click the
state or transition and select Set Breakpoint. For
states, the default breakpoints are On State
Entry and During State.
For transitions, the default breakpoint is When
Transition is Valid. To change the type of breakpoint, click
the breakpoint badge and select a different configuration of breakpoints. For
more information, see Manage Breakpoint Types and Conditions.
To remove the breakpoint, right-click the state or transition and select Clear Breakpoint. To remove all of the breakpoints in a chart, right-click inside the chart and select Clear All Breakpoints In Chart.
Manage Breakpoint Types and Conditions
A breakpoint badge can represent more than one type of breakpoint. To see a
tooltip that lists the breakpoint types that are set on a state or transition, point
to its badge. In this example, the badge on the state A
represents two breakpoint types: On State Entry and
During State.

To change the type of breakpoint on an object, click the breakpoint badge. In the Breakpoints dialog box, you can select a different configuration of breakpoints, depending on the object type. Clearing all of the check boxes in the Breakpoints dialog box removes the breakpoint.

To limit the number of times that the execution stops at a breakpoint, add a
condition to the breakpoint. By default, a Stateflow chart pauses whenever it reaches a breakpoint. When you add a
condition to a breakpoint, the chart pauses at the breakpoint only when the
condition is true. For example, with these conditions, the breakpoints on state
A pause the execution of the chart only when the value of
x is negative.

To specify a condition for the breakpoint, you can use any valid MATLAB expression that combines numerical values and Stateflow data objects that are in scope at the breakpoint.
Control Chart Execution After a Breakpoint
When execution stops at a breakpoint, Stateflow enters debugging mode.
The MATLAB command prompt changes to
K>>.The Symbols pane displays the value of each data object in the chart.
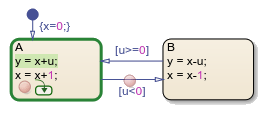
The chart highlights active elements in blue and the currently executing object in green.
For example, when the execution stops at the breakpoint in state
A, the border of the state and the first statement in the
state entry action appear highlighted in green.
An execution status badge appears in the graphical object where execution pauses.
| Badge | Description |
|---|---|
| Execution is paused before entering a chart or in a
state |
| Execution is paused in a state
|
| Execution is paused in a state |
| Execution is paused before testing a transition. |
| Execution is paused before taking a valid transition. |
When the chart is paused at a breakpoint, you can continue the execution by using:
Buttons in the Debug tab
The MATLAB Command Window
Keyboard shortcuts
| Action | Debug Tab Button | MATLAB Command | Keyboard Shortcut | Description |
|---|---|---|---|---|
| Continue |
| dbcont | Ctrl+T | Continue execution to the next breakpoint. |
| Step Over |
| dbstep | F10(Shift+Command+O on macOS systems) | Advance to the next step in the chart execution. At the chart level, possible steps include:
For more information, see Execution of a Stateflow Chart. |
| Step In |
| dbstep in | F11(Shift+Command+I on macOS systems) | From a state or transition action that calls a function, advance to the first executable statement in the function. From a statement in a function containing another function call, advance to the first executable statement in the second function. Otherwise, advance to the next step in the chart execution. (See the Step Over option.) |
| Step Out |
| dbstep out | Shift+F11(Shift+Command+U on macOS systems) | From a function call, return to the statement calling the function. Otherwise, continue execution to the next breakpoint. (See the Continue option.) |
| Stop |
| dbquit | Ctrl+Shift+T | Exit debug mode and interrupt the execution. When you execute the standalone chart from the Stateflow Editor, this action removes the chart object from the MATLAB workspace. |
In state or transition actions containing more than one statement, you can step through the individual statements one at a time by selecting Step Over. The Stateflow Editor highlights each statement before executing it.
Note
Because standalone charts define temporal logic in terms of wall-clock time, a temporal logic operator can become valid while a chart is paused at a breakpoint. In this case, the chart exits debugging mode and the execution continues to the next breakpoint.
Examine and Change Values of Chart Data
When Stateflow is in debug mode, the Symbols pane displays the value of each data object in the chart. You can also examine data values by pointing to a state or a transition in the chart. A tooltip displays the value of each data object used in the selected state or transition.
To test the behavior of your chart, in the Symbols pane, you
can change the value of a data object during execution. Alternatively, at the
debugging prompt, enter the new value by using the keyword this in place of the chart object name. For instance,
to change the value of the local data x,
enter:
this.x = 7
Note
When debugging a chart in a Simulink model, do not use the keyword this. Instead,
you can access all Stateflow data directly at the debugging prompt. For more information, see
View and Modify Data in the MATLAB Command Window.