Create Parent and Child Operating Modes
In Stateflow® charts, you can create nested operating modes by placing a state inside the border of an existing state. The existing state is called a parent state, and the states it contains are called child states.
The contents of the parent state act like a smaller chart. Similar to a chart, the parent state contains a default transition. When the parent state becomes active, the child state connected to the default transition also becomes active. Then, the chart transitions between the child states. When the parent state deactivates, the child states also deactivate.
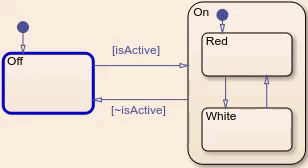
For instance, in this model of the emergency lights on an ambulance, the On state has the child states Red and White. When On is active, the ambulance switches between the colored lights, starting with the Red state. When On deactivates, both lights deactivate.
In this example, you use child states to model the variable charging rates in a rechargeable battery system.
Open Model
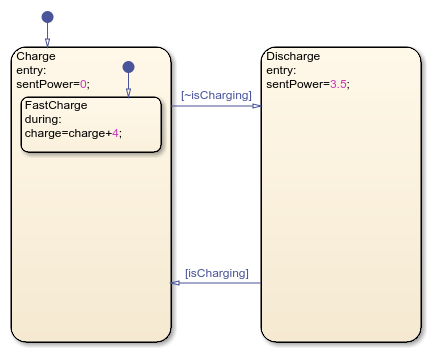
The sfGetStartedBattery model represents the control logic for a rechargeable battery system. To build the model, follow the instructions in the previous steps of the tutorial.

Double-click the Chart block to enter the battery chart.

The states Charge and Discharge represent the operating modes of the battery system. The input data isCharging determines the active state. The output data sentPower and local data charge represent the output wattage and charge level of the battery.
Add Child States to Model Hierarchy
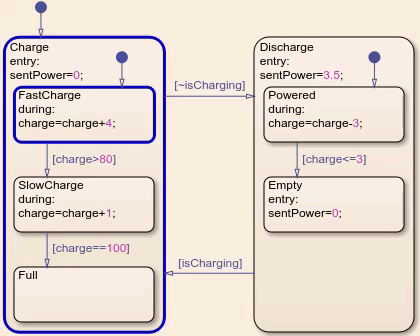
Currently, the battery system continues charging when full and discharging when empty. To represent full, empty, and intermediate charging modes, the battery system requires additional operating modes:
| Parent Mode | Child Mode | Actions | Exit Condition |
|---|---|---|---|
Charge |
FastCharge |
While active, increase the charge level at a rate of 4% | When the charge level is greater than 80%, move to
SlowCharge |
Charge |
SlowCharge |
While active, increase the charge level at a rate of 1%. | When the charge level is equal to 100%, move to
Full |
Charge |
Full |
None | None |
Discharge |
Powered |
While active, decrease the charge level at a rate of 3%. | When the charge level is less than or equal to 3%, move to
Empty |
Discharge |
Empty |
On entry, set the output wattage to 0 | None. |
Add a state that represents fast charging.
In the
ChargeandDischargestates, remove theduringactions.Expand the
ChargeandDischargestates so that they can contain up to three child states. To resize a state, click any corner and drag outward.In
Charge, add a child state namedFastCharge. Child states must be fully enclosed by the parent state. The borders of the child and parent states cannot overlap.In
FastCharge, add aduringaction that increments the datachargeby4.
Add two states that represent slow and paused charging.
Add a child state named
SlowCharge. Add aduringaction that incrementschargeby1.Add a transition from
FastChargetoSlowChargethat executes whenchargeexceeds80.Add a child state named
Full.Add a transition from
SlowChargetoFullthat executes whenchargeequals100.

Add two states that represent normal and paused discharging.
In
Discharge, add a child state namedPowered. Add aduringaction that decrementschargeby3.Add another child state named
Empty. Add anentryaction that setssentPowerto0.Add a transition between
PoweredandEmptythat executes whenchargeis less than or equal to3.

Simulate the Model
Observe how the chart transitions between child states.
In the Simulink Editor, ensure the Manual Switch block is set to
1.In the Simulation tab, click Run to simulate the model. In the first step, the
ChargeandFastChargeboth activate. Aschargeincreases, the chart transitions to child statesSlowChargeandFull. In the Symbols pane,chargenever exceeds100.Return to the top-level Simulink model. Toggle the value of the Manual Switch block by double-clicking the block.
Enter the chart. The chart activates the state
Dischargeand the child statePowered. Whenchargedecreases below3, the chart transitions fromPoweredtoEmpty. In the Symbols pane,chargenever goes below0.
The battery model is now more realistic. However, the design still has problems. For example, if the connected device requires less than 3.5 watts of power, the battery output does not change.
In the next step in the tutorial, you create a flow chart that varies the power output of the battery system according to the demand of the connected device.