Execution Parameters
To get debug information about the target computer and the real-time application, use the execution parameter blocks. Debug information includes information about target computer CPU overloads and the execution time reached by the real-time application.
Functions
startProfiler | Start profiling service on target computer |
stopProfiler | Stop profiling service on target computer |
getProfilerData | Retrieve profile data object |
resetProfiler | Reset profiling service state to Ready
|
getPersistentVariables | Get persistent variables from the Simulink Real-Time target computer to MATLAB (Since R2022a) |
setPersistentVariables | Set persistent variables from MATLAB to the Simulink Real-Time target computer (Since R2022a) |
Blocks
| SLRT Overload Options | Select CPU overload options |
| Persistent Variable Read | Read persistent variable value from target computer (Since R2022a) |
| Persistent Variable Write | Write persistent variable value to target computer (Since R2022a) |
Related Information
Featured Examples
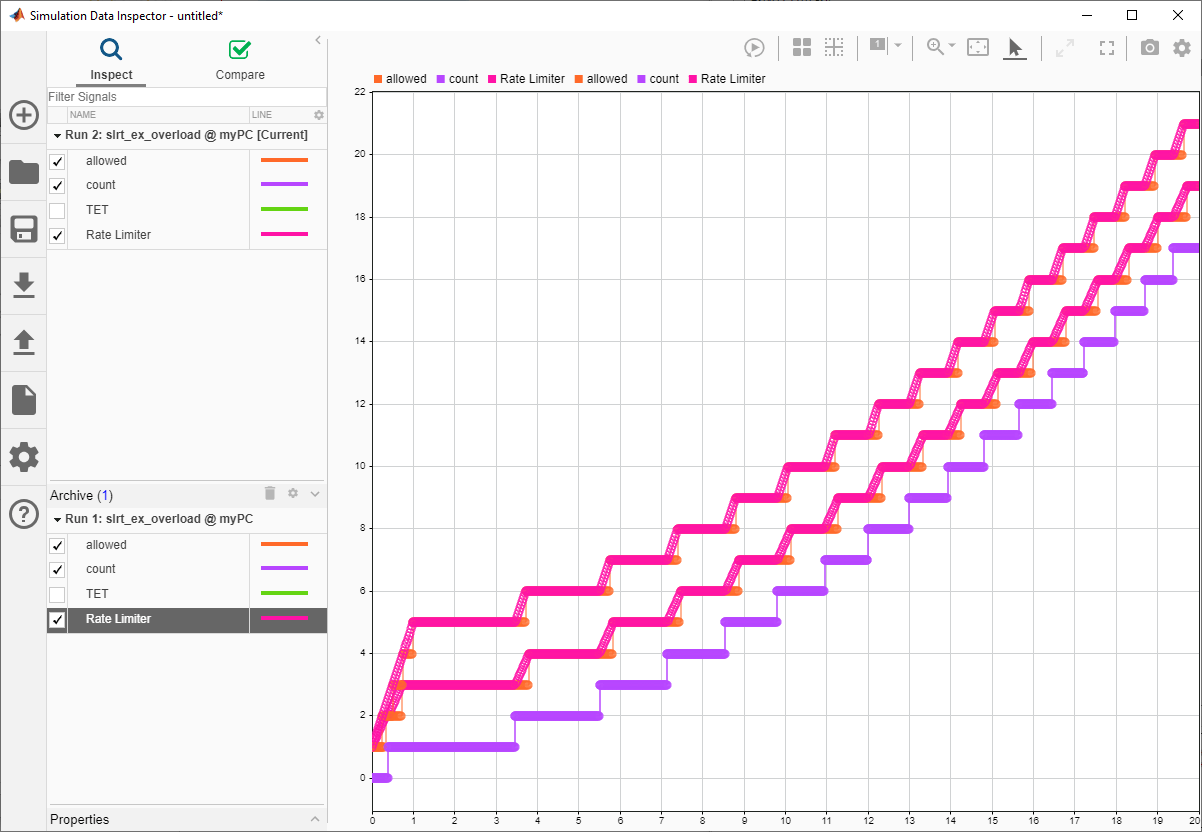
Monitor CPU Overload Rate
Design a model that uses the SLRT Overload Options block to monitor the rate at which CPU overloads occur.

Apply Persistent Variables in Real-Time Applications
Apply Simulink Real-Time persistent variables to preserve variable values when the real-time application stops or the target computer is powered off.