sdo.scatterPlot
Scatter plot of samples
Description
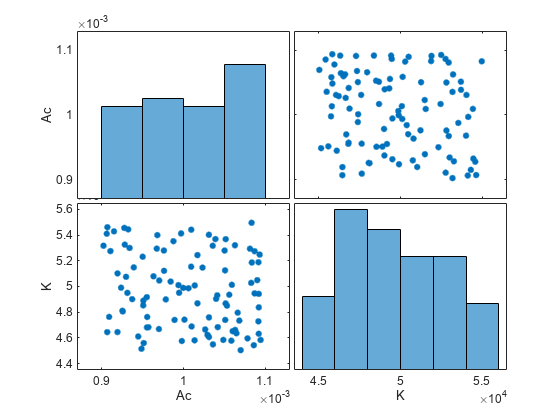
sdo.scatterPlot( is
the same as X)sdo.scatterPlot(X,X), except that the
subaxes along the diagonal are replaced with histogram plots of the
data in the corresponding column of X. For example,
the subaxes along the diagonal in the ith column
is replaced by hist(X(:,i)).
Examples
Input Arguments
Output Arguments
Version History
Introduced in R2014a


