Detect and Fix Compliance Issues
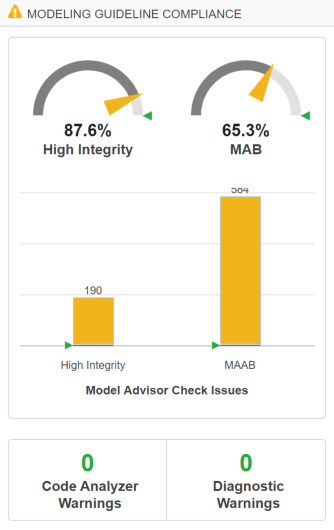
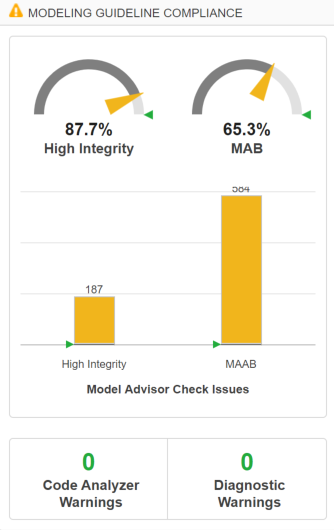
When you collect metric data, the Metrics Dashboard runs the MAB and high-integrity Model Advisor checks in the background. The Modeling Guideline Compliance section of the dashboard provides the percentages of checks that pass and a count of check warnings and errors. You can interactively investigate these fixes by toggling between the dashboard and your model.
Explore Compliance Results in the Dashboard
In the Metrics Dashboard, locate the Modeling Guideline Compliance section. This section displays the percentage of high-integrity and MAB compliance checks that pass on all systems. The bar charts show the number of issues reported by the checks in each check group.

To see a table that details the number of compliance issues by component, click on the High Integrity bar chart. For more information on this metric, see Model Advisor Check Issues for High-Integrity Systems.
From the table, click the
Throttlecomponent hyperlink. TheThrottlecomponent opens in the model editor. The model editor highlights blocks in the component that have compliance issues. The Model Advisor Highlighting dialog box lists checks that do not highlight results.
In the Metrics Dashboard, return to the main dashboard page by clicking the Dashboard icon.
Click the High Integrity percentage gauge.
The Grid view enables you to identify patterns in results. The grid contains a row for each model component and a column for each check. To see check and component names, hover over a table element.
To see the status for each compliance check, click the Table view.
Expand the
sldemo_fuelsysnode.To explore check results in more detail, click the Check safety-related diagnostic settings for model referencing hyperlink.
In the Model Advisor Highlighting dialog box, click Check safety-related diagnostic settings for model referencing hyperlink.
A Model Advisor report opens. The report lists current model configuration settings and their recommended values.
Update Model to Fix Compliance Issues
To change the current value of a parameter to the recommended value, click a parameter. The Configuration Parameters dialog box opens.
Change the parameter setting to what the Recommended Value column in the report indicates.
Click Apply and close the dialog box.
Close the Model Advisor report.
In the Model Advisor Highlighting dialog box, click the Check safety-related diagnostic settings for compatibility check. The Model Advisor report opens.
For this check, repeat steps 1 through 4.
In the Model Advisor Highlighting dialog box, click the Check safety-related diagnostic settings for bus connectivity check.
For this check, repeat steps 1 through 4.
Close the Model Advisor Highlighting dialog box and return to the Metrics Dashboard table.
Rerun Model Metrics
In the Metrics Dashboard table, return to the main dashboard page, by clicking Dashboard.
To rerun the model metrics, click All Metrics.
Confirm that the number of High Integrity check issues has reduced.

Next, use the Actual Reuse and Potential Reuse widgets to investigate and replace clones across a model hierarchy.