Analyze Your Project with Dashboards
The Dashboard window offers a central location where you can open dashboards for software units and components in your project, view metric results, analyze affected artifacts, and generate reports on the quality and compliance of the artifacts in your project.
Open New Dashboard
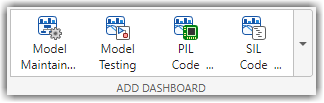
To open a dashboard, use the Dashboards gallery in the Add Dashboard section of the toolstrip to select a type of dashboard:
Click Model Maintainability to analyze the size, architecture, and complexity of the MATLAB®, Simulink®, and Stateflow® artifacts in your project.
For more information, see Monitor Design Complexity Using Model Maintainability Dashboard.
Click Model Testing to assess the traceability and completeness of the models, requirements, tests, and test results in your project.
For more information, see Explore Status and Quality of Testing Activities Using Model Testing Dashboard.
Click PIL Code Testing to assess the status and quality of your processor-in-the-loop (PIL) code testing.
For more information, see View Status of Code Testing Activities for Software Units in Project.
Click SIL Code Testing to assess the status and quality of your software-in-the-loop (SIL) code testing.
For more information, see View Status of Code Testing Activities for Software Units in Project.
By default, a new dashboard tab opens for the first artifact in the Project panel. The Project panel displays artifacts from the current project that are compatible with the currently selected dashboard. Click the name of an artifact to view the dashboard results for that specific artifact.
View Help for Metric Information
The dashboards use widgets to display the metric results. When you point to a widget, a three-dot icon appears in the top-right corner of the widget.

Point to the three dots and click the Help icon ![]() to view more information about the metric and how
the dashboard calculates the metric value.
to view more information about the metric and how
the dashboard calculates the metric value.

Navigate Dashboard Window
The Dashboard window contains multiple sections:
Project panel — The Project panel displays artifacts from the current project that are compatible with the currently selected dashboard. By default, the dashboard analyzes all models inside your project folder and considers:
Simulink models as units
System Composer™ architecture models as components
A unit is a functional entity in your software architecture that you can execute and test independently or as part of larger system tests. A component is an entity that integrates multiple testable units together. Click the three dots to the right of each unit or component to view more information about that artifact. If you want to specify different models in your software architecture as units and components, you can add project labels to the entities and configure the dashboard options to recognize the labels. For more information, see Categorize Models in Hierarchy as Components or Units.

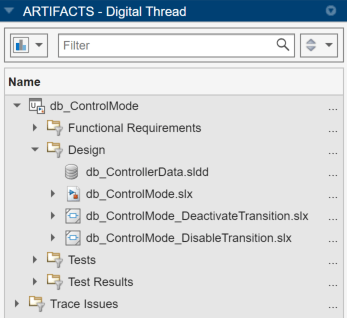
Artifacts panel — Use the Artifacts panel to view the Functional Requirements, Design, Tests, and Test Results folders, which contain the artifacts the dashboard traces to the current artifact selected in the Project panel. For example, the Design folder for a unit might show the data dictionary, model, and subsystem references associated with the unit. The Artifacts panel uses a digital thread of project information to capture and track information about the artifacts in your project and the relationship between artifacts. Click the three dots to the right of each folder or artifact to view more information.
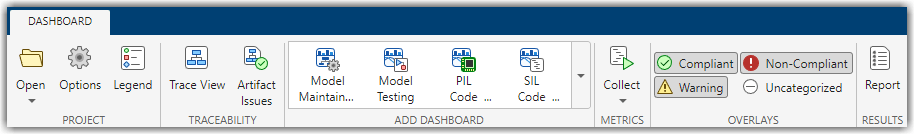
Dashboard toolstrip
Use the Project section of the toolstrip to open a project, specify how the dashboard identifies units and components, and change the layout that the dashboard uses.
Use the Add Dashboard section to select a type of dashboard to open.
The Metrics section shows the options for tracing artifacts and collecting metric results. By default, the dashboards automatically trace the artifacts in your project and collect metrics when you initially select a dashboard. However, you can use the Metrics section if you need to manually trace artifacts, manually collect metric results, collect metric results for each of the units and components in the project, or turn off the automatic tracing and collecting settings.
The Overlays section shows which types of overlays are enabled. The dashboard uses overlays to show if the metric results are compliant with the metric thresholds, noncompliant with the metric thresholds, generate a warning, or uncategorized because there are no metric thresholds specified. By default, the dashboard starts with the Compliant, Non-Compliant, and Warning buttons selected. To turn an overlay on or off, click the button for the overlay to select or clear the overlay.
In the Results section, click the Report button to specify the report settings and to generate a report of metric results.
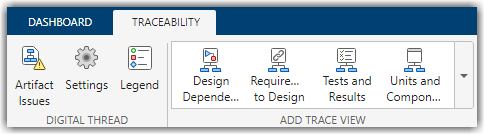
Traceability toolstrip
Use the Digital Thread section of the toolstrip to view artifact issues in the project and modify digital thread settings like trace information caching. You can troubleshoot warnings and errors associated with project artifacts by clicking Artifact Issues. To modify the digital thread settings, click the Settings button. You can view a list of the icons for artifacts that the dashboard traces by using the Legend.
Explore traceability relationships by using the trace views in the Add Trace View section of the toolstrip. For more information, see Explore Traceability Information Using Trace Views.
See Also
Specify Models as Components and Units | Model Maintainability Metrics