Animate and Understand Sending and Receiving Messages
This example shows how to send, receive, and visualize messages. The example also shows how to use Simulation Data Inspector, Sequence Viewer, Animation, and Storage Inspector to understand how messages flow in your model.

Model Description
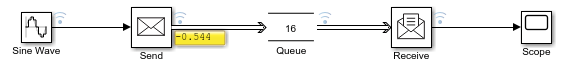
The SimpleMessagesModel contains these blocks:
Sine Wave — The signal source. The Sample time parameter of the block is set to
0.1.
Send — Converts data signals and send messages. The specified value for the Sample time parameter of the Sine Wave block determines the rate at which the Send block sends messages. Therefore, the Send block sends one message every
0.1simulation time.
Queue — Stores messages. Observe the message line between the Send block and the Queue block. The default capacity of the queue is
16, which means the Queue block can store at most16messages. The default message sorting behavior isLIFO, which means incoming messages are sorted based on last-in-first-out policy. By default, the Overwrite the oldest element if queue is full check box is selected. When the queue is full, an incoming message overwrites the oldest message in the queue. For more information about using the Queue block, see Use a Queue Block to Manage Messages.
Receive — Receives messages and converts them to signal data. In the block, Sample time parameter is set to
0.1. The Receive block receives a message every 0.1 simulation time.
Scope — Visualizes messages received by the Receive block.
Simulate the Model and Review Results
In the model, data logging is enabled for the signal and message lines among Sine Wave, Send, Queue, Receive, and Scope blocks.
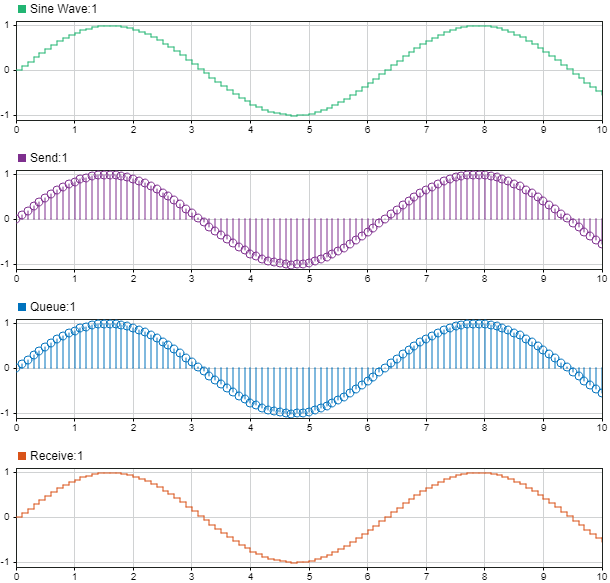
Simulate the SimpleMessagesModel and observe from the Simulation Data Inspector that:
The Sine Wave block generates the sine wave signal (green).
Every
0.1simulation time, Send block converts the value of the signal to a message and sends it to the Queue block. Simulation Data inspector displays messages as stem plots. Observe the Simulation Data Inspector displaying sent messages (purple).
The Queue block sends messages to the Receive block (blue).
Receive block output is the reconstructed sine wave signal (orange).
Use Sequence Viewer to Visualize Messages
You can use the Sequence Viewer tool or the Sequence Viewer block to visualize messages, events, and Simulink® function calls. The Sequence Viewer displays message transition events and the data that the messages carry. In the Sequence Viewer window, you can view event data related to Stateflow® chart execution and the exchange of messages between Stateflow charts.
To use the Sequence Viewer tool:
To activate logging events, in the Simulink Toolstrip, on the Simulation tab, in the Prepare section, click Log Events.

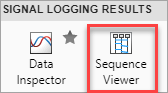
Simulate your model. To open the Sequence Viewer tool, on the Simulation tab, in the Review Results section, click Sequence Viewer.
The Log events and Sequence Viewer buttons are visible when your model has blocks from the Simulink Messages & Events library, a Stateflow chart, Function-Call Subsystem, Simulink Function, or SimEvents® blocks.
The Sequence Viewer window shows messages as they are created, sent, forwarded, received, and destroyed at different times during model execution. The Sequence Viewer window also displays state activity, transitions, and function calls to Stateflow graphical functions, Simulink functions, and MATLAB® functions.

You can also add the Sequence Viewer block to your model for visualizing message transitions. For more information, see Use a Queue Block to Manage Messages.
Use Animation and Storage Inspector
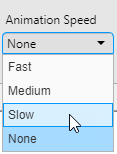
You can use Animation to animate the model and observe the message flow between model components. You can specify the speed of the animation as Slow, Medium, or Fast. The option None disables the model animation.
In the toolstrip, on the Debug tab, locate the Event Animation section.
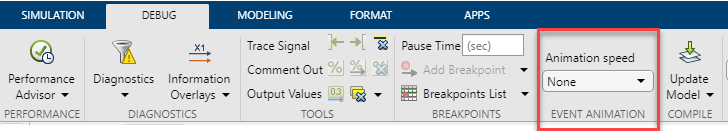
From the Event Animation section, set the animation speed to Slow.
Simulate the model again. Observe the highlighted message lines representing message flow between the blocks.

Animation highlights message lines and Simulink function calls based on events rather than time passed. Within one simulation time, more than one message flow or Simulink function call event can be highlighted.
Pause the animation. In the Simulink Toolstrip, on the Debug tab, click Pause. Observe that the last highlighted message line is highlighted in violet.

The Storage Inspector allows you to visualize the details of the stored messages in Queue block. When you pause the simulation, the Storage Inspector magnifying glass icon appears on the Queue block. To open the Storage Inspector, click the magnifying glass.

The Storage Inspector does not show any stored messages because messages arriving at the Queue block are simultaneously received by the Receive block at the same simulation time.
To create a scenario with stored messages, stop the simulation and change the Sample time parameter of the Receive block to 0.5. Now the Send block sends one message every 0.1 simulation time, but the Receive block receives messages every 0.5 simulation time. This causes a backlog of messages that are stored in the Queue block.
Simulate the model again with animation speed set to Slow, and pause the simulation to check the status in the Storage Inspector. An entity in the Storage Inspector represents stored elements in the Queue block, in this case, messages. Storage Inspector lists the messages stored in the Queue block with their ID and data value carried by each message.

Display Message Payload Using Port Value Labels
To display message data using port value labels, right-click the message line emerging from a block, and then click the Show port value label button.

In the example below, the port value label displayed on the message line that connects the Send block to the Queue block.
If a message carries data as a bus, you can also select the bus elements to display in the port value label.
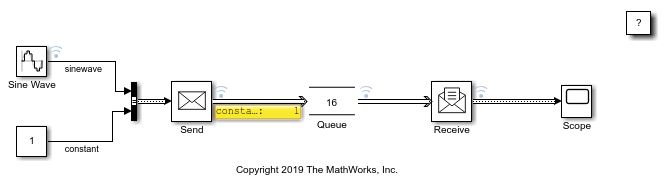
The SimpleMessagesPortValueModel is a variation of the SimpleMessagesModel where the input to the Send block comes from a Bus Creator block. In this example, a bus object Data_message is created with two elements, sinewave and constant.
To open this model, enter:
open_system('SimpleMessagesPortValueModel');
Right-click the message line emerging from the Send block, click Show Port Value Label On Selected Signal, and select constant.

Only the values of the constant signal are displayed in the port value label.
If the message transmission stops on a message line, the port value label keeps displaying the last message payload value.
See Also
Sine Wave | Send | Receive | Queue | Hit Crossing Probe | Sequence Viewer
Topics
- Simulink Messages Overview
- Generate C++ Messages to Communicate Data Between Simulink and an Operating System or Middleware (Embedded Coder)
- View Signal Values Using Port Value Labels
- Use a Queue Block to Manage Messages
- Establish Message Send and Receive Interfaces Between Software Components
- Use the Sequence Viewer to Visualize Messages, Events, and Entities