Understanding Total Time and Self Time in Profiler Reports
The Simulink® Profiler displays the performance of the components of your model and their simulation phases. Each row of the Profiler Report pane presents the following information:
Path
Time Plot (Dark Band = Self Time)
Total Time (s)
Self Time (s)
Number of Calls
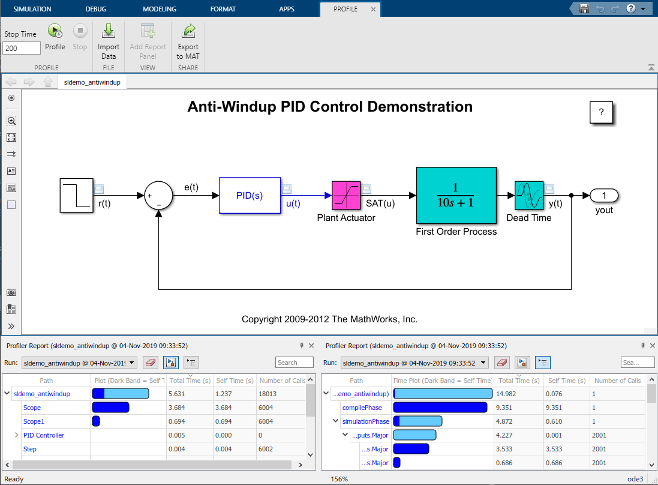
An indicator of the model's performance is the number of times a block is called in conjunction with the time taken by each call. For a model component with any level of hierarchy, it is useful to know how much of its total execution time is taken up by its constituent blocks vis-a-vis the time taken by its own execution, or self-time.
Use the Total Time(s) information to identify subsystems or referenced models that are expensive to run within the current model. As subsystems and model references typically correspond to high-level conceptual entities such as physical models and algorithms, you can identify which component of your model is slowing down overall performance.
The graphic below shows part of the Profiler Report pane for the
sldemo_fuelsys_dd model.
To begin, recursively expand the hierarchy of the Engine Gas Dynamics subsystem. For the Throttle subsystem, tally the total time of its constituents (from threshold=0.5 to Sonic Flow), highlighted in red. Observe that the sum of their execution times, along with the self time for Throttle block, is the total time of the Throttle block, shown in yellow.
Collapse the Throttle row of the hierarchy. Repeat the previous step for the contents of the Throttle & Manifold subsystem–which is highlighted in yellow–and then the Engine Gas Dynamics subsystem.
