Perform Predictive Maintenance for Rotating Device Using Machine Learning Algorithm on Arduino
This example shows how to use Simulink® Support Package for Arduino® Hardware to predict and monitor the health of a rotating device using a machine learning algorithm. Using the support package, you can collect data from rotating device connected to an internet of things (IoT) sensor to monitor its condition and performance.
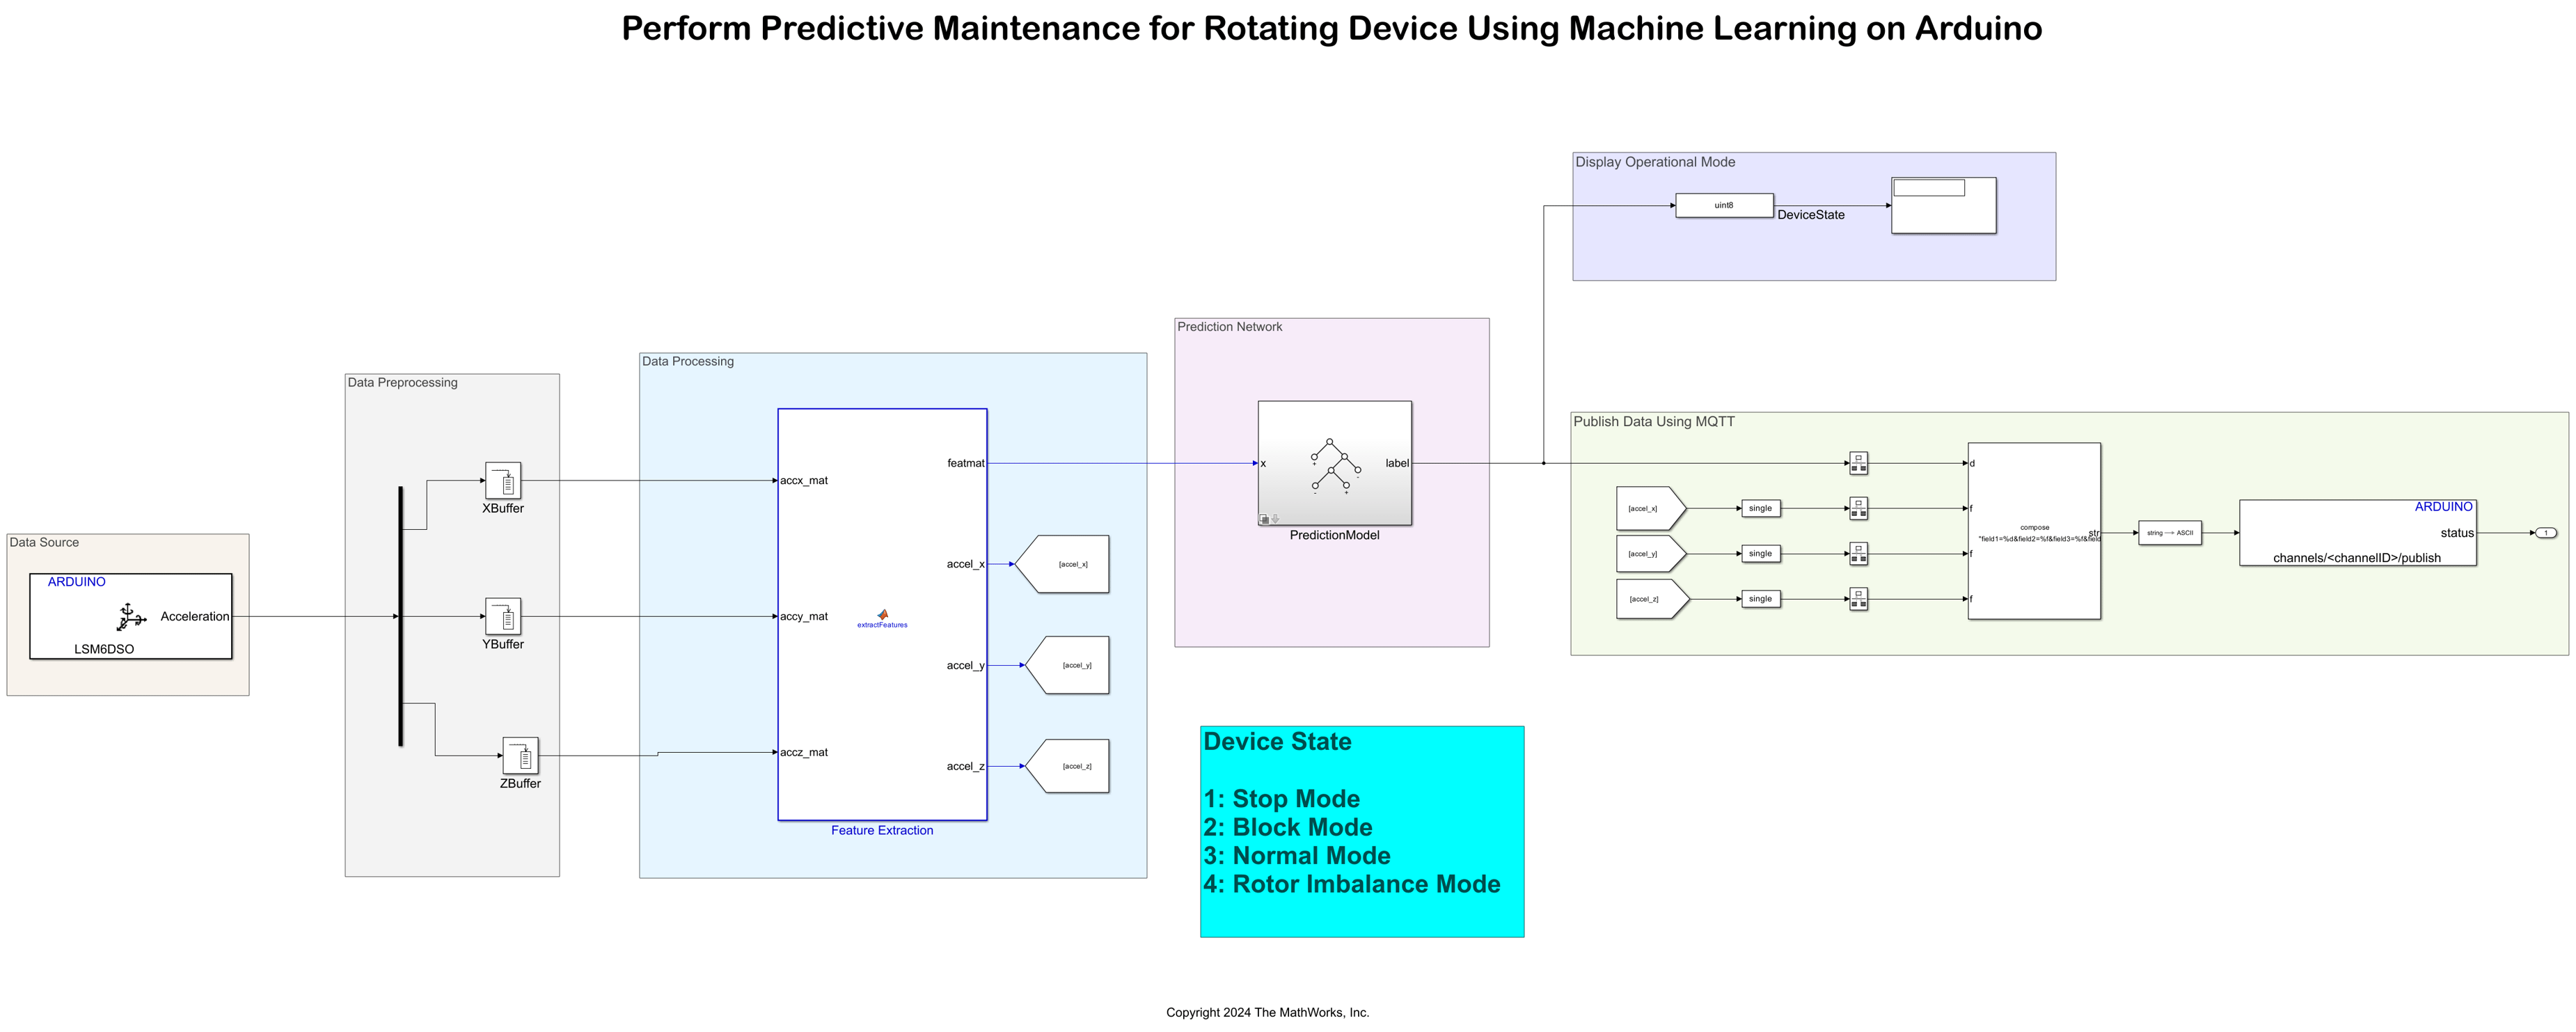
In this example, you use an IMU sensor to collect data from the rotational device, extract features, train the data using a classifier algorithm, build a predictive model, and identify its operational modes (Stop, Block, Normal, and Rotor imbalanced) to fix them before they fail. The Arduino board determines the state of the rotating device by sensing the vibrations, by using the on-board inertial measurement unit (IMU) sensor, in the X-, Y-, and Z-directions.
You can extract features such as mean, root mean square (RMS), and power spectral density from the vibration data of the rotating device, which are required to further classify the data and to develop a predictive model to identify the defined operational modes.
To view the operational state of the device using ThingSpeak™, configure ThingSpeak as the MQTT broker and set up your Arduino board as the MQTT client to publish data to your ThingSpeak channel.
This figure provides an overview of this example and explains each step.
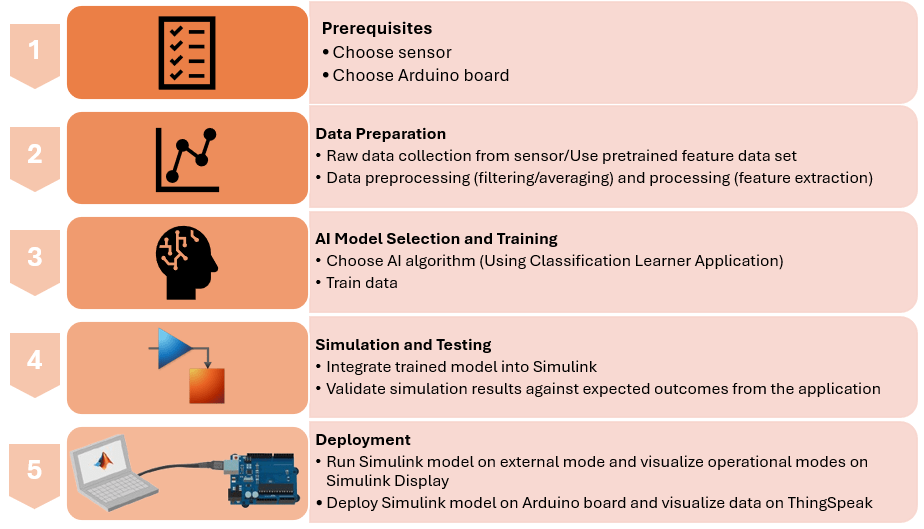
Prerequisites
For more information on how to use the Simulink Support Package for Arduino Hardware to run a Simulink model on your Arduino board, see Get Started with Arduino Hardware.
For more information on using machine learning in embedded applications, see the Developing and Deploying Machine Learning Solutions for Embedded Applications video.
For more information on MQTT protocol, see MQTT Basics (ThingSpeak).
Supported Arduino Boards
Selecting the right Arduino board for this application primarily depends on these factors:
1. The arduino_predictiveMaintenance Simulink model uses the WiFi MQTT Publish block. So, the list of Arduino boards on which you can run and deploy the Simulink model are limited to these boards:
Arduino MKR WiFi 1010
Arduino MKR 1000
Arduino Nano 33 IoT
Arduino compatible ESP32 - WROOM board
Arduino compatible ESP32 - WROVER board
Arduino Nano RP2040 Connect
Raspberry Pi® Pico (Arduino Compatible)
Raspberry Pi Pico W (Arduino Compatible)
2. Memory requirements of the classifier or predictive model that you choose to accurately predict the operational modes of the device using the raw data obtained from the sensor. You can calculate the program and data memory to run and deploy the Simulink model on your Arduino board effectively. For more information, see Supported Arduino Hardware and the AI Model Selection and Training section of this example. This example uses the Arduino Nano RP2040 Connect board that supports the Arduino WiFi MQTT Publish block and has a program and data memory of 16 MB and 520 KB, respectively.
Select Sensor to Acquire Acceleration Data
This example uses the on-board LSM6DSO IMU sensor on Arduino Nano RP2040 Connect board. If you select a different Arduino board from the Supported Arduino Boards section and connect an external IMU sensor to the board, map the pins as shown in this table to connect the sensor to the Arduino board.

Required Hardware
Supported Arduino board.
Any device that has moving parts. This example uses a rotating device like a fan.
Connecting wires.
Any object that you can use to block the normal operational mode of the device. This example uses a cardboard.
Adhesive or sticking tape.
Hardware Setup
Connect the Arduino boards to your host computer using the USB cable.
Ensure that your Arduino board is connected to Wi-Fi®.
Secure your Arduino board to the rotating device. Use an adhesive or a piece of tape to secure the hardware board. Make sure that the connecting wires do not obstruct the device when it vibrates.
Data Preparation
You can either use the pretrained data set available in MATLAB® for training the deep learning algorithm or acquire raw data from any acceleration IMU sensor. To use the pretrained data set, refer to the Prepare Data Set for Training Deep Learning Algorithm section. To use raw data, refer to the Collect Raw Data from IMU Sensor section.
Prepare Data Set for Training Deep Learning Algorithm
To load the pretrained feature data set in MATLAB, run this command in the MATLAB Command Window.
load arduino_training_data_pdm.mat
Verify that the trainingData table is loaded to the MATLAB Workspace. This table contains a 283-by-34 matrix of features extracted for a fan. These features represent attributes measured by the sensor such as, acceleration or vibration. The sensor calculates these features by using the raw acceleration data from the X-, Y-, and Z-axes for the fan operating in four different modes.
Observe that the mean values are stored in columns 1 through 3, root mean square values in columns 4 through 6, and power spectral density values for each axis in columns 7 through 33. The 34th column defines the operational mode of the device.
Collect Raw Data from IMU Sensor
Acquire raw data from any IMU sensor to obtain acceleration values along the X-, Y-, and Z-axes. This example uses the LSM6DSO IMU sensor.
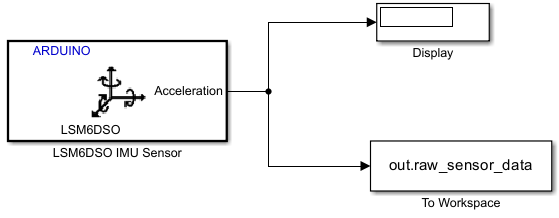
1. To save the acceleration data obtained from the IMU sensor in a MAT file, first create a new Simulink model. Then, add these blocks to the model canvas:
a. Add any one of the sensor blocks from the Acceleration Sensors library in Simulink Support Package for Arduino Hardware. This example uses the LSM6DSO IMU Sensor block.
b. Add the Display block from the Simulink/Dashboard library.
c. Add the To Workspace block from the Simulink/Sinks library.
Connect the Acceleration port of the LSM6DSO IMU Sensor block to the input ports of the Display and To Workspace blocks.
Configure these parameters in the To Workspace Block Parameters dialog box.
Set the Variable Name parameter to
raw_sensor_data.Set the Save format parameter to
Array.Set the Save 2-D signals as parameter to
2-D array (concatenate along first dimension).Set the Sample time parameter to
0.02.
Configure these parameters in the LSM6DSO IMU Sensor Block Parameters dialog box.
In the Select outputs section, select
Acceleration (m/s^2)and configure the acceleration parameters in the Advanced tab of the sensor block.Set the Sample time parameter to
0.02for the sensor to capture the acceleration data every 0.02 seconds.
The Display block displays the 1-by-3 vector output for the acceleration data along the X-, Y-, and Z-axes.
On the Hardware tab of the Simulink model, in the Mode section, select Run on board and then click Monitor & Tune.
For capturing data in the Stop mode, make sure to power off the. Similarly, for capturing data in the Normal mode, power on the device. Use a piece of cardboard or any other object to block any moving part of the device when the device is powered on. For the Rotor Imbalanced mode, you can move or shake the entire device setup. Observe the acceleration data stored in the raw_sensor_data.mat file.
The LSM6DSO IMU Sensor captures the acceleration data every 0.02 seconds. The X-, Y-, and Z-buffers store the 1-by-3 vector output for the acceleration data along the X-, Y-, and Z-axes.
Feature Extraction
Use the MATLAB code in the arduino_pdm_extract_features.m function file to extract features from the raw acceleration data for the four modes of operation for your device. This function calculates the mean, root mean square (RMS), and power spectral density for the raw acceleration data and stores them in adjacent columns in the raw_sensor_data.mat file. The function calculates these features for every 50 data sample values.
In this MATLAB function:
samplesPerObservationis the number of samples that the IMU sensor captures.accx_mat,accy_mat, andaccz_matcorrespond to the input acceleration data received from the IMU sensor for the X-, Y-, and Z-axes, respectively.featmatcorresponds to the entire feature data set.feature1,feature2, andfeature3correspond to the mean values calculated for the X-, Y-, and Z-input acceleration data, respectively.
You can execute this MATLAB function for one operational mode at a time and capture the features. These features are stored in column 1 through 33 of the MAT file. To capture the acceleration data in all the operational modes, run these commands in the MATLAB Command Window.
extracted_features = arduino_pdm_extract_features(out,1); % stop mode
extracted_features = [extracted_features; arduino_pdm_extract_features(out,2)]; %block mode
extracted_features = [extracted_features; arduino_pdm_extract_features(out,3)]; % normal mode
extracted_features = [extracted_features; arduino_pdm_extract_features(out,4)]; % rotor imbalance mode
AI Model Selection and Training
The Classification Learner app helps you explore supervised machine learning using various classifiers. Using this app, you can explore your data, select features, specify validation schemes, train models, and assess results. You can perform automated training to search for the best type of classification model for your application. You can perform supervised machine learning by supplying a known set of input data (observations or examples) and known responses to the data (such as labels or classes). You use this data to train a model that generates predictions for the response to new data. To use the model with new data, or to learn about programmatic classification, you can export the model to the workspace or generate MATLAB code to recreate the trained model. For more information, see the Classification Learner App (Statistics and Machine Learning Toolbox).
1. To open the Classification Learner app, enter classificationLearner in the MATLAB Command Window. You can also find the app on the Apps tab, under Machine Learning.
2. In the Classification Learner tab of the app, click New Session and select From Workspace. Make sure that the extracted_features.mat file is present in the MATLAB Workspace.
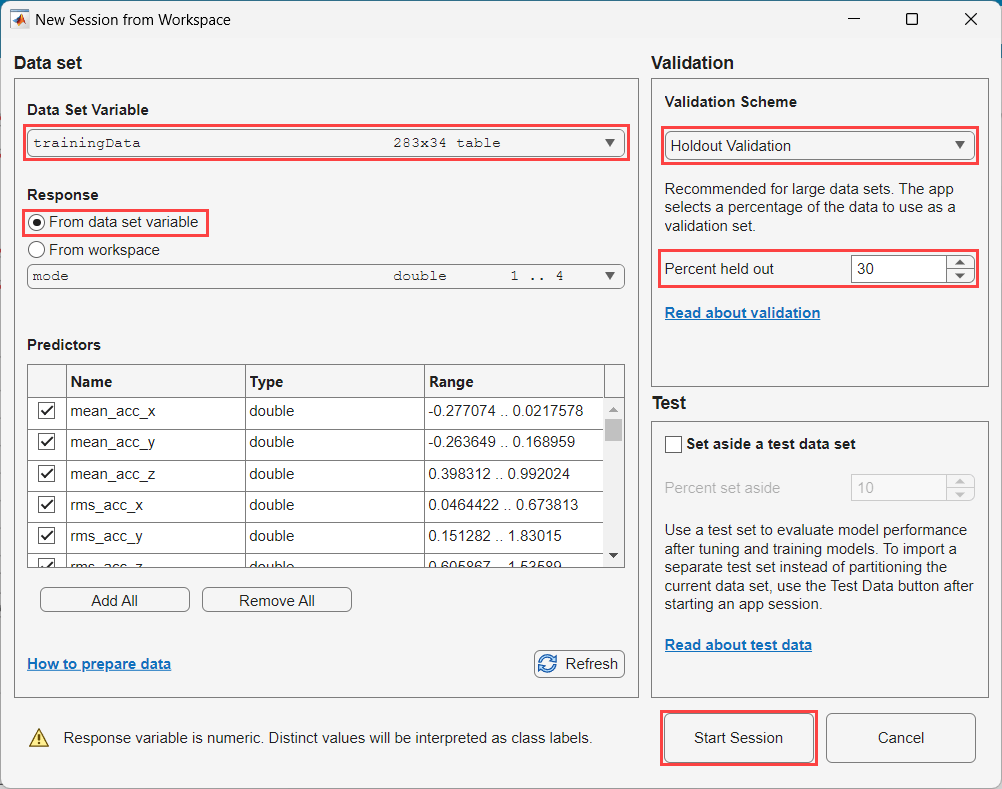
3. In the New Session from Workspace dialog box, select the extracted_features.mat file from the Data Set Variable list.
4. In the Response section, select From data set variable and select the response column of your MAT file from the drop-down list. In this example, select the mode column.
5. In the Validation section, select Holdout Validation. Select percentage of the data to use as a validation set. The app trains a model on the training set and assesses its performance with the validation set. The model that the app uses for validation is based on only a portion of the data, so use the Holdout Validation option only for large data sets. The app trains the final model with the full data set. In this example, Percent held out is set to 30, which means that the app uses 70% of the data for training the machine learning algorithm.
6. Click Start Session.
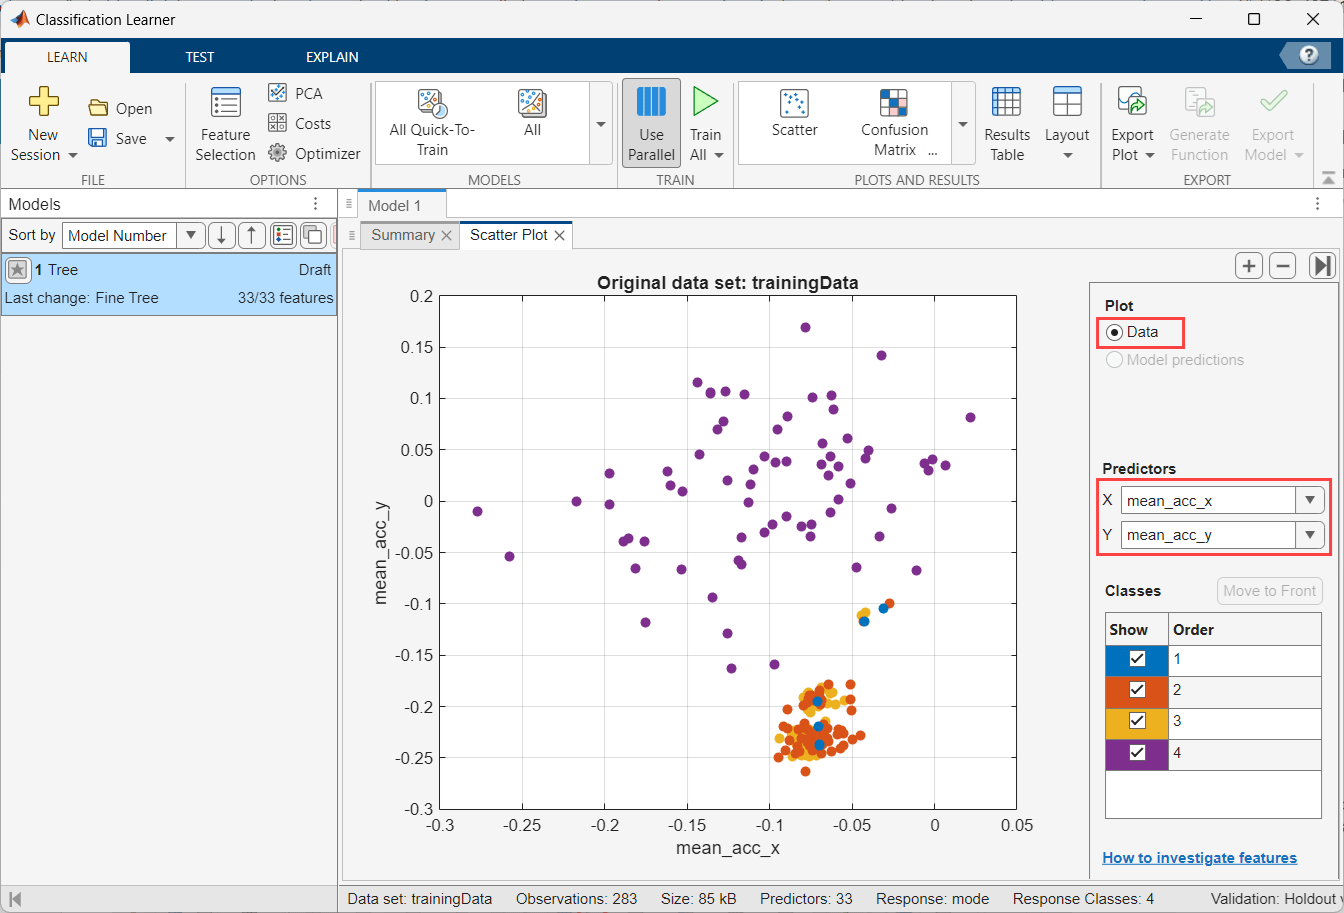
7. Before you train a classifier, the Scatter Plot shows the data. In the Plot section, select Data to plot only the data.
8. Choose features to plot using the X and Y lists under Predictors. Select predictor inputs that separate classes well by plotting different pairs of predictors on the scatter plot. For example, plotting the extracted_features.mat data, you can see that the RMS values of acceleration data along the Z-axis and the mean values of acceleration data along the Y-axis separate class 4, which corresponds to the Rotor Imbalance mode. Plot other predictors to see if you can separate the other classes. You can add or remove predictors using the check boxes in the Classes section.
9. To create a classification model, on the Learn tab, in the Model Type section, expand the gallery and select the type of model to train using the data. For this example, select All to try training all model types.
10. In the Train section, click Train All and select Train All. A selection of model types appears in the Models pane. When the models finish training, the best percentage Accuracy (Validation) score is outlined in a box.
11. Click models in the Models pane and open the corresponding plots to explore the results. You can compare and improve trained classification models using several different features in the app. For more information, see Compare and Improve Classification Models (Statistics and Machine Learning Toolbox).
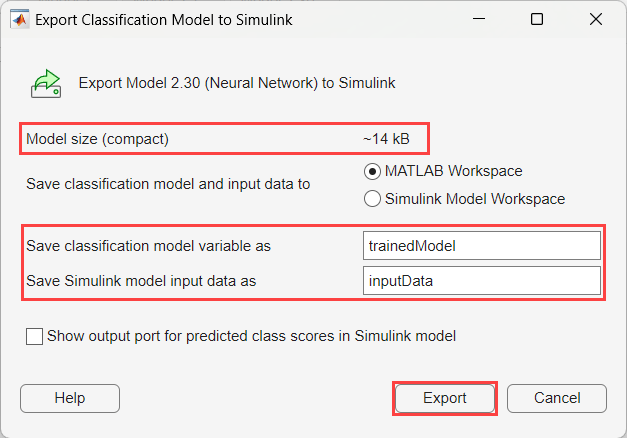
12. To export the model to the workspace, on the Learn tab, in the Export section, click Export Model and select Export Model to Simulink. In the Export Classification Model to Simulink dialog box, enter the name of the workspace variable to which to export the model and click Export. In this example, the workspace variable is named trainedModel. For more information, see Export Classification Model to Make Predictions in Simulink (Statistics and Machine Learning Toolbox).
MATLAB creates an NeuralNetworkModelFromClassificationLearner.mat file in the current directory of the example. This MAT file contains a structure that defines all the properties for the Neural Network classification model of the data trained using the Classification Learner App (Statistics and Machine Learning Toolbox). The app launches Simulink and creates a new NeuralNetworkModelFromClassificationLearner.slx Simulink model.
Similarly, the app creates a new Simulink model for the classification model you choose to export.
Simulation and Testing
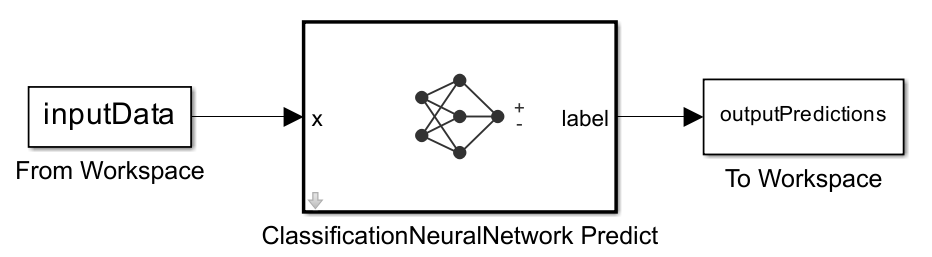
From the NeuralNetworkModelFromClassificationLearner.slx Simulink model, copy the ClassificationNeuralNetwork Predict block. In the arduino_predictiveMaintenance.slx Simulink model, click the down arrow in the variant subsystem PredictionModel. Paste the ClassificationNeuralNetwork Predict block into this subsystem.
The variants subsystem PredictionModel allows you to encapsulate multiple implementations or variations of a system component in a separate hierarchy in the model. Each variation of the component represented within a Variant Subsystem block is referred to as a choice. Only one of the variant choices within the Variant subsystem block can be active during model execution. For more information on how to use the Variant Subsystem, see How to Use Variant Subsystem, Variant Subsystem, and Implement Variations in Separate Hierarchy Using Variant Subsystems.
Open the variants subsystem PredictionModel.
Two Subsystem blocks represent the two possible variations of the PredictionModel component: ClassificationTree Predict and ClassificationNeuralNetwork Predict. Note that there are no drawn connections between the blocks inside the Variant Subsystem block. Simulink automatically wires the active variant to the Inport and Outport blocks of the Variant Subsystem block during simulation and disables the inactive ports.
Right-click on the PredictionModel block and select Block Parameters (Subsystem) to open the Block Parameters dialog box. The Variant choices table lists the choices of the variant subsystem. Each variant choice in the PredictionModel block is associated with a variant control.
Set Variant control mode to label. In this mode, Simulink chooses the active variant based on the name of the variant.

You can simulate the model under different operational modes to observe the simulation results for each mode and understand the dynamic behavior of the model. To simulate the model, in the Simulation tab, click Run. Validate the simulation results for different classification models and ensure that the model performs as you intend.
Configure Simulink Model and Calibrate Parameters
This example uses a preconfigured Simulink model from Simulink Support Package for Arduino Hardware. Open the arduino_predictiveMaintenance Simulink model.
In the Data Preprocessing area, the X-, Y-, and Z-buffers store the 1-by-3 vector output for the acceleration data along the X-, Y-, and Z-axes.
Configure these parameters in the Block Parameters dialog box of the X, Y, and Z Buffer (DSP System Toolbox) blocks.
Set Output buffer size to
50.Set Buffer overlap to
25.
Each buffer stores 50 data samples every 0.02 seconds corresponding to each axis.
The Rate Transition blocks in the Data Processing area, transfer the calculated mean data from the accel_x, accel_y, and accel_z outputs of the extractFeatures MATLAB Function block, operating at one rate, to the inputs of the WiFi MQTT Publish block, operating at a different rate.
Configure MQTT Properties for Simulink Model
In the Simulink model, go to the Configuration Parameters dialog box > Target hardware resources > MQTT properties and configure these properties.
Set Broker service to
ThingSpeak.After ThingSpeak generates a list of credentials (username, client ID, and password) for the Arduino board, populate these credentials in the Username, Password, and Client ID parameters of the MQTT properties.
For more information on MQTT properties, see MQTT properties.
Configure WiFi Properties for Simulink Model
In the Simulink model, go to the Configuration Parameters dialog box > Target hardware resources > WiFi properties and configure the WiFi properties.
Cloud-Based Communication Using ThingSpeak
ThingSpeak cloud can help you view and monitor the health of a rotating device from a remote location. You can view the operational mode of the rotating device in ThingSpeak cloud.
Create ThingSpeak Device
MQTT access to your channel, including credentials, is handled by a ThingSpeak MQTT broker. Your Arduino board is configured with the credentials necessary for your MQTT client to communicate with ThingSpeak, and for authorizing specific channels. For more information on how to create an MQTT device, see Create a ThingSpeak MQTT Device (ThingSpeak). Make a note of the list of credentials that ThingSpeak generates. For more information on how to create multiple fields on a channel, see Collect Data in a New Channel (ThingSpeak).
Configure ThingSpeak Channel
Follow these steps to configure the ThingSpeak channel.
Log in to your ThingSpeak account.
Select Channels > New Channel.
Enter a unique name in the Name parameter.
Enter a description for the channel in the Description parameter.
To display four parameters on the dashboard, select Field1, Field2, Field3, and Field4.
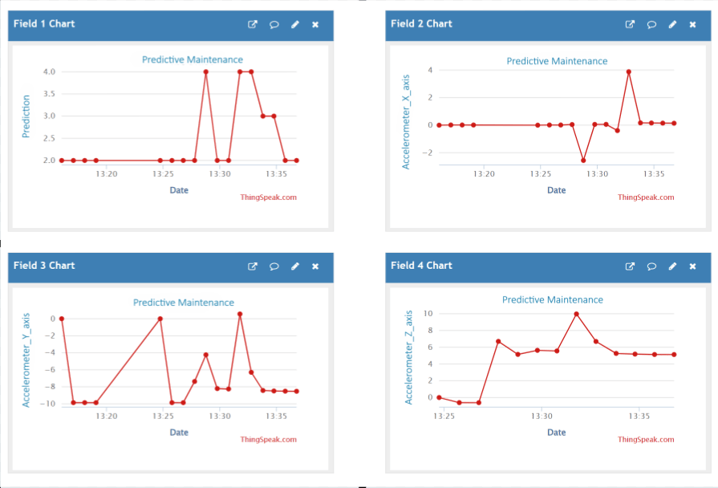
Enter the names Prediction, Accelerometer_X_axis, Accelerometer_Y_axis, and Accelerometer_Z_axis in the fields 1, 2, 3, and 4, respectively.
Click Save Channel. A dashboard screen is displayed with four sections.
In the Block Parameter dialog box of the WiFi MQTT Publish blocks in the model, set the topic of the message to which the Arduino board publishes the message. The topic must use the format: channels/<channelID>/publish. You can obtain the channel ID from the ThingSpeak channel.
Run Model in External Mode
If you decide to use Display as a hosting solution to display the operational mode of the rotating device, on the Hardware tab of the Simulink model, in the Mode section, select Run on board and then click Monitor & Tune. Observe the different operational modes of the device on the Display block.
Deploy Simulink Model on Arduino
If you decide to use ThingSpeak as a hosting solution to display the operational mode of the rotating device, you can deploy the arduino_predictiveMaintenance Simulink model to your Arduino board.
On the Hardware tab of the Simulink model, in the Mode section, select
Run on boardand then click Build, Deploy & Start.Operate the device in four different modes of operation: Stop, Normal, Block, and Rotor Imbalanced.
Observe the four sections of the real-time data displayed on the ThingSpeak channel. The WiFi MQTT Publish block updates the data on the ThingSpeak channel every 60 seconds.
Other Things to Try
Besides the acceleration data, you can also use temperature as an indication of a device not functioning as expected while performing predictive maintenance. Temperature anomalies can be a sign of issues such as overheating, component failure, or inefficiencies in the device. Use the Temperature port of the LSM6DSO IMU Sensor block to output the real-time temperature values at the surface of the device.