Main Content

strips

R2026b

Description

strips(x) plots x in horizontal strips of length 250.

example

strips(x,n) plots x in strips that are each n samples long.

strips(x,sd,Fs) plots x in strips of duration sd given the sample rate of Fs samples per second.

example

strips(x,sd,Fs,scale) also scales the vertical axes.

example

Examples

collapse all

Partition a signal into frames. Strip plot all signal frames.

Load a data file with a 73113-sample signal y. Partition a signal into 16384-sample frames with a 2048-sample overlap and padding the last frame with zeros. Show all the frames in a strip plot.

load handel
yfs = framesig(y,16384,OverlapLength=2048, ...
    IncompleteFrameRule="zeropad");
ns = size(yfs,2);

strips(yfs)

grid
xlabel("Sample Number")
ylabel("Frame Number")
yticklabels(ns:-1:1)
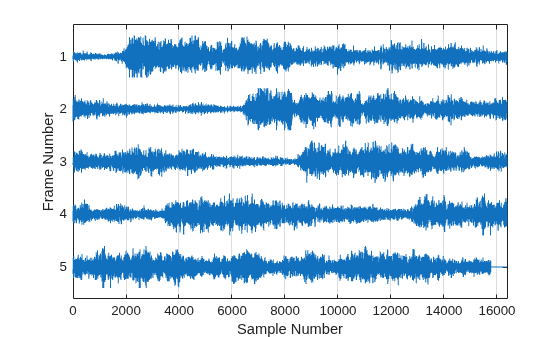
Figure contains an axes object. The axes object with xlabel Sample Number, ylabel Frame Number contains an object of type line.

Plot two seconds of a frequency-modulated sinusoid in 0.25-second strips. Specify a sample rate of 1 kHz.

fs = 1000;
t = 0:1/fs:2;
x = vco(sin(2*pi*t),[10 490],fs);

strips(x,0.25,fs)
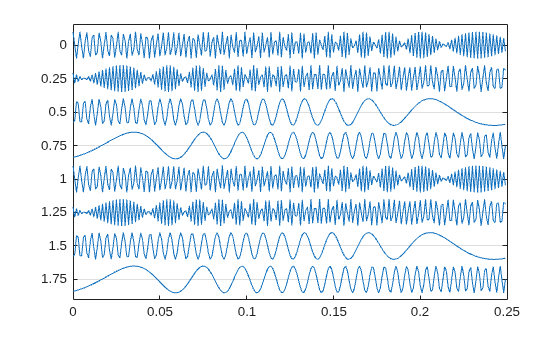
Figure contains an axes object. The axes object contains an object of type line.

Load a speech signal sampled at Fs=7418Hz. The file contains the recording of a female voice saying the word "MATLAB®."

load mtlb

Plot the signal in 0.18-second long strips. Scale the vertical axes to 125%.

strips(mtlb,0.18,Fs,1.25)
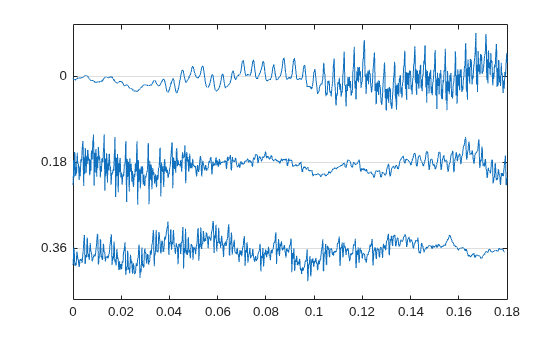
Figure contains an axes object. The axes object contains an object of type line.

Input Arguments

collapse all

Input signal, specified as a vector or matrix.

  • If x is an M-by-N matrix and you do not specify additional input arguments:

    • The strips function plots each column of x on a separate horizontal strip.

    • The strips function labels the y-axis ticks as 0, M, ⋯, (N–1)M.

  • If x is an M-by-N matrix and you specify additional input arguments, either by using the strips(x,n) or strips(x,sd,Fs) syntaxes:

    • The strips function divides each column of x into L-sample segments, where L is either n or ceil(sd*Fs) samples. If L does not exactly divide M, then the strips function assumes the remaining samples as part of the final strip.

    • The strips function plots each segment of x on a separate horizontal strip, overlaying all columns on the same strip.

    • The strips function labels the y-axis ticks as 0, L, ⋯, (⌈M/L⌉–1)L.

Note

The function ignores the imaginary part of complex-valued x.

Data Types: single | double
Complex Number Support: Yes

Length of strips, specified as a real positive scalar.

Duration in seconds, specified as a positive scalar.

Specify sd and Fs simultaneously to distinguish duration and sample rate inputs (sd,Fs) from length input (n).

Sample rate in hertz, specified as a positive scalar.

Scale factor, specified as a scalar. The strips function ignores the imaginary part of complex-valued scale.

Data Types: single | double
Complex Number Support: Yes

Version History

Introduced before R2006a

See Also

|