Main Content

firpmord

Parks-McClellan optimal FIR filter order estimation

Description

[n,fo,ao,w] = firpmord(f,a,dev) returns the order estimate n, normalized frequency band edges fo, frequency band amplitudes ao, and weights w that meet input specifications f, a, and dev.

[___] = firpmord(___,fs) specifies a sample rate fs. fs defaults to 2 Hz, implying a Nyquist frequency of 1 Hz.

example

c = firpmord(___,"cell") returns a cell array c whose elements are the parameters to firpm.

example

Examples

collapse all

Design a minimum-order lowpass filter with a 500 Hz passband cutoff frequency and 600 Hz stopband cutoff frequency. Specify a sample rate of 2000 Hz. Require at least 40 dB of attenuation in the stopband and less than 3 dB of ripple in the passband.

rp = 3;           % Passband ripple in dB 
rs = 40;          % Stopband ripple in dB
fs = 2000;        % Sample rate
f = [500 600];    % Cutoff frequencies
a = [1 0];        % Desired amplitudes

Convert the deviations to linear units. Design the filter and visualize its magnitude and phase responses.

dev = [(10^(rp/20)-1)/(10^(rp/20)+1) 10^(-rs/20)]; 
[n,fo,ao,w] = firpmord(f,a,dev,fs);
b = firpm(n,fo,ao,w);
freqz(b,1,1024,fs)
title("Lowpass Filter Designed to Specifications")

Figure contains 2 axes objects. Axes object 1 with title Phase, xlabel Frequency (kHz), ylabel Phase (degrees) contains an object of type line. Axes object 2 with title Lowpass Filter Designed to Specifications, xlabel Frequency (kHz), ylabel Magnitude (dB) contains an object of type line.

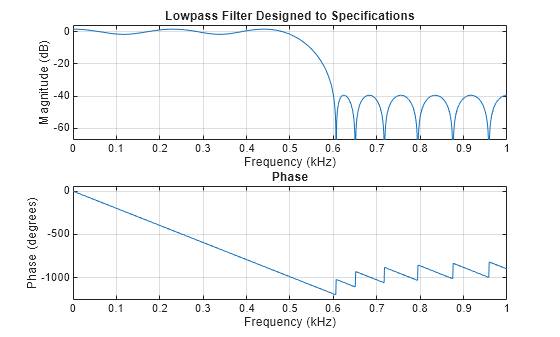
The filter falls slightly short of meeting the stopband attenuation and passband ripple specifications. Using n+1 instead of n in the call to firpm achieves the desired amplitude characteristics.

Design a lowpass filter with a 1500 Hz passband cutoff frequency and a 2000 Hz stopband cutoff frequency. Specify a sample rate of 8000 Hz. Require a maximum stopband amplitude of 0.1 and a maximum passband error (ripple) of 0.01.

[n,fo,ao,w] = firpmord([1500 2000],[1 0],[0.01 0.1],8000);
b = firpm(n,fo,ao,w);

Obtain an equivalent result by having firpmord generate a cell array. Visualize the frequency response of the filter.

c = firpmord([1500 2000],[1 0],[0.01 0.1],8000,"cell");
B = firpm(c{:});
freqz(B,1,1024,8000)

Figure contains 2 axes objects. Axes object 1 with title Phase, xlabel Frequency (kHz), ylabel Phase (degrees) contains an object of type line. Axes object 2 with title Magnitude, xlabel Frequency (kHz), ylabel Magnitude (dB) contains an object of type line.

Input Arguments

collapse all

Frequency band edges, specified as a real-valued vector with an even number of elements. The argument must be in the range [0, Fs/2], where Fs is the Nyquist frequency. The number of elements in the vector is always a multiple of 2. The frequencies must be in increasing order.

Desired amplitudes at the points contained in f, specified as a vector. f and a must satisfy the condition length(f) = 2length(a) – 2.

Maximum allowable deviation, specified as a vector with the same size as a and with elements the range within the interval (0; 1).

This argument specifies the maximum deviation or ripple between the desired amplitudes for each band and the amplitude response of the estimated Parks-McClellan optimal FIR filter.

Sample rate, specified as a real scalar.

Output Arguments

collapse all

Filter order estimate, returned as a nonnegative integer.

Normalized frequency points, specified as a real-valued vector. The argument must be in the range [0, 1] , where 1 corresponds to the Nyquist frequency. The number of elements in the vector is always a multiple of 2. The frequencies must be in increasing order.

Amplitude response, returned as a real-valued vector.

Weights used to adjust the fit in each frequency band, specified as a real-valued vector. The length of w is half the length of f and a, so there is exactly one weight per band.

FIR filter parameters, returned as a cell array.

Algorithms

The firpmord function uses the algorithm presented in [1]. This function produces inaccurate results for band edges close to either 0 or the Nyquist frequency, fs/2.

Note

  • In some cases, firpmord underestimates or overestimates the order n. If the filter does not meet the specifications, try a higher order such as n+1 or n+2.

  • In some cases, the algorithm estimates a negative value for the filter order. If that happens, the function returns n as 0.

References

[1] Rabiner, Lawrence R., and Otto Herrmann. “The Predictability of Certain Optimum Finite-Impulse-Response Digital Filters.” IEEE® Transactions on Circuit Theory. Vol.  20, Number 4, 1973, pp. 401–408.

[2] Rabiner, Lawrence R., and Bernard Gold. Theory and Application of Digital Signal Processing. Englewood Cliffs, NJ: Prentice-Hall, 1975, pp. 156–157.

Extended Capabilities

expand all

Version History

Introduced before R2006a