Robust Controller Design Using Mu Synthesis
The technique of μ synthesis extends the methods
of H∞ synthesis to design a robust controller for an
uncertain plant. You can perform μ synthesis on plants with parameter
uncertainty, dynamic uncertainty, or both using the musyn command.
musyn seeks a controller that minimizes the robust
H∞ performance of the closed-loop system. The
robust H∞ performance, also called
μ, quantifies how modeled uncertainty affects the performance of a
feedback loop. For details about μ and how it is computed, see Robust Performance Measure for Mu Synthesis.
Basic μ Synthesis Workflow
You can use musyn to:
Synthesize "black box" unstructured robust controllers.
Robustly tune a fixed-order or fixed-structure controller made up of tunable components such as PID controllers, state-space models, and static gains.
μ Synthesis of Unstructured Controllers
μ synthesis of unstructured controllers is analogous to controller
synthesis with hinfsyn, except that the plant includes uncertainty.
As with hinfsyn, you set up your problem as the feedback system
CL = lft(P,K), where P is the plant and
K is the controller to design.
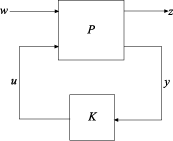
In the diagram:
w represents the disturbance inputs.
u represents the control inputs.
z represents the error outputs to be kept small.
y represents the measurement outputs provided to the controller.
You construct the uncertain plant P by building a state-space model
with uncertain coefficients (ureal or ucomplex) blocks,
uncertain dynamics (ultidyn blocks), or both. Construct the plant such
that the measurement outputs y are the last outputs, and the control
inputs u are the last inputs. As with hinfsyn, you
can optionally augment the plant inputs and outputs with weighting functions (loop-shaping
filters) that represent control objectives.
You then pass this plant to musyn, which seeks a controller
K that minimizes the robust
H∞ performance. The controller is
returned as a state-space model. For a simple example, see Unstructured Robust Controller Synthesis on the
musyn reference page.
μ Synthesis of Fixed-Structure Controllers
Instead of obtaining a controller that is a free-form state-space model, you can
specify a fixed controller structure with tunable parameters. musyn
then adjusts those parameters to minimize the robust
H∞ performance of the system.
μ synthesis of fixed-structure controllers is analogous to controller
tuning with hinfstruct, except that the plant includes uncertainty.
To set up your problem for fixed-structure μ synthesis, you
construct a generalized state-space (genss) model of the uncertain
closed-loop system with tunable controller elements. To do so, you create and
interconnect:
Numeric LTI models representing the fixed components of the control system
Uncertain control design blocks such as
urealandultidynblocks representing the uncertain components of the plantOptional LTI weighting functions (loop-shaping filters) that represent control objectives
Tunable control design blocks such as
tunablePID,tunableSS, andtunableGainto represent tunable components of the system
For an example that shows how to build such a model, see Build Tunable Control System Model with Uncertain Parameters.
You pass the tunable, uncertain closed-loop model to musyn, which
seeks values of the tunable parameters that optimize the robust
H∞ performance from the model inputs to its
outputs. For a simple example, see Robust Tuning of Fixed-Structure Controller on the
musyn reference page.
If you have a Simulink® model of your control system, you can use slTuner to
linearize the model with specified uncertain parameters and tunable blocks. You then use
getIOTransfer to extract a genss model for
controller design with musyn. For an example, see Model Uncertainty in Simulink for Robust Tuning.
Interpret the Results of μ Synthesis
musyn returns a robust controller K (for
unstructured controller tuning) or a tuned version of the control system
CL (for fixed-structure controller tuning). It also returns the best
achieved robust H∞ performance as the
CLperf output argument. This value tells you that with the controller
returned by musyn, the peak gain of the closed-loop system remains
below CLperf for uncertainty up to 1/CLperf in
normalized units. For example:
CLperf= 0.5 means that the closed-loop gain remains below 0.5 for uncertainty up to twice the uncertainty specified in the input model. The worst-case gain for the specified uncertainty is typically smaller.CLperf= 2 means that the closed-loop gain remains below 2 for uncertainty up to half the uncertainty specified in CL. For this value, the worst-case gain for the full specified uncertainty can be much larger. It can even be infinite, meaning that the system does not remain stable over the full range of the specified uncertainty.
For more detailed information about this quantity and how it is computed, see Robust Performance Measure for Mu Synthesis.
To find K, musyn uses an iterative process
called D-K iteration. This process solves a sequence of scaled
H∞ problems. The frequency-dependent scalings,
called D and G scalings, take advantage of the
uncertainty structure. To perform D-K iteration, musyn:
Uses H∞ synthesis to find a controller that minimizes the closed-loop gain of the nominal system.
Performs a robustness analysis to estimate the robust H∞ performance of the closed-loop system. This quantity is expressed as a scaled H∞ norm involving the D and G scalings (the D step).
Finds a new controller to minimize the H∞ norm obtained in step 2 (the K step).
Repeats steps 2 and 3 until the robust performance stops improving.
For mathematical details about how this algorithm works, see D-K Iteration Process.
musyn gives you two ways to monitor and interpret the progress of
the algorithm: the default display and the full display.
Default musyn Display
By default, musyn provides a brief display of algorithm progress in
the MATLAB® command window. For instance:
DG-K ITERATION SUMMARY:
-------------------------------------------------------------------
                       Robust performance                 Fit order
-------------------------------------------------------------------
  Iter         K Step       Peak MU       DG Fit           D      G
    1             100        5.747        6.394           10      4
    2           5.221        3.433        4.607           10      6
    3           2.682        2.263        2.627           10      4
    4           1.987        1.687         2.18           10      6
    5           1.287        1.192        1.377           10      8
    6           1.079        1.087         1.09           10      8
    7           1.076        1.046        1.055            8      6
    8           1.049        1.024        1.044           10      6
    9           1.045        1.022        1.039            8      6
   10            1.04        1.023        1.033            8      6

Best achieved robust performance: 1.02
The display includes information about each D-K iteration.
K Stepcolumn — For the first iteration, this value is the H∞ performance of the closed-loop nominal system after controller synthesis. For remaining iterations, this column shows the scaled H∞ norm after controller synthesis.Peak MUcolumn — Robust performance (, an upper bound on μ) for the controller designed in theK Step.DG fitcolumn — Scaled H∞ performance after fitting the D and G scalings with rational functions.Fit ordercolumns — Orders of the rational function used to fit the scalings in that iteration. If the system has only complex uncertainty, or when the'MixedMU'option ofmusynOptionsis set to'off', thenmusyndoes not apply G scaling. In that case, only the D fit order is listed.
If you see a large difference between the Peak MU and DG
Fit values in a given iteration, it is a sign that musyn
cannot find a good fit for the scalings. In that case, you can try increasing the maximum
fit order using the 'FitOrder' option of musynOptions.
For other ways to improve the results, see Improve Results of Mu Synthesis.
Full musyn Display
You can obtain a more detailed view into the progress of D-K iteration by setting the
'Display' option of musynOptions to
'full'. If you turn on the full display, then
musyn pauses after each D-K iteration so that you can view the
detailed results of the iteration. In addition to the information described in Default musyn Display, the full display:
Shows detailed computation information for the controller synthesis (K step) of the current iteration. For unstructured controllers, see
hinfsynfor information about this display. For fixed-structure controllers, seehinfstructOptions.Shows information about the fits for the D scalings and the G scalings (if any) of the current iteration. The information includes the fit order of the scalings for each uncertain block. It also includes a goodness-of-fit score. A score less than or equal to 1 indicates adequate fit for μ synthesis.
Generates plots that let you visualize the D and G fits, the robust performance before fitting, and the scaled H∞ performance after fitting. Examining these plots can help you determine if the maximum fit order is high enough to capture all the frequency-dependent variation in the scalings (see the
FitOrderoption ofmusynOptionsfor more information).
The D Fit or D,G Fit plot shows the scaling data
and the corresponding rational fits.
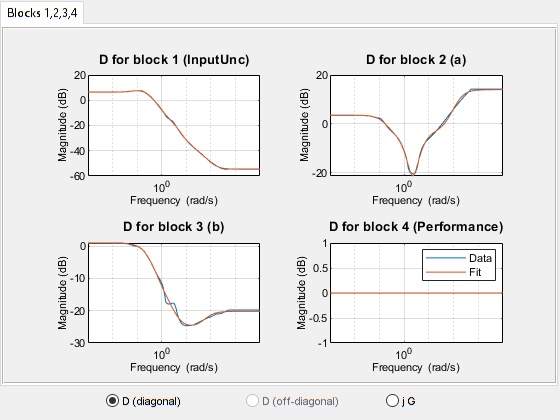
Use the radio buttons to select which scalings to inspect:
D (diagonal)shows the magnitude of the diagonal elements of the D scalings.D (offdiagonal)shows the magnitude and phase of the off-diagonal elements of the D scalings. This plot is available when your system has repeated uncertain blocks. (See the'FullDG'option ofmusynOptionsfor more information.)jGshows the magnitude and phase of the G-scalings. G scalings are present only when there is real uncertainty and theMixedMUoption ofmusynOptionsis'on'. See Improve Results of Mu Synthesis.
The Robust Performance plot shows the performance of the closed-loop
system before and after fitting.
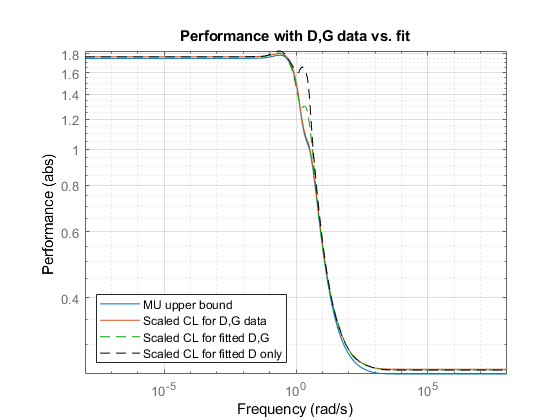
The traces on this plot are:
MU upper bound— Robust performance, the upper bound as a function of frequencyScaled CL for D,G data— Scaled H∞ performance before fitting the D and G scaling data with rational functionsScaled CL for fitted D,G— Scaled H∞ performance after fittingScaled CL for fitted D only— Shows what behavior would not be captured if G were omitted
For detailed information about the D-K iteration algorithm and the meaning of all the quantities in the full display, see D-K Iteration Process.