show
Show collision geometry
Description
show( shows the collision geometry in
the current figure at its current pose. The function automatically generates the
tessellation.geom)
show(
specifies options using one or more name-value pair arguments in addition to any
combination of input arguments from previous syntaxes. For example, geom,Name=Value)FaceColor=[1
1 1]
Examples
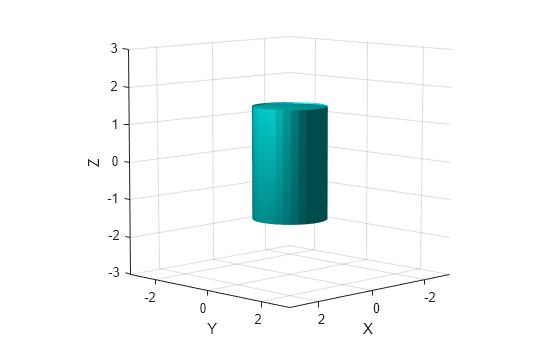
Create a cylinder collision geometry. The cylinder has a length of 3 meters and a radius of 1 meter.
cyl = collisionCylinder(1,3);
Show the cylinder.
show(cyl)
title("Collision Geometry")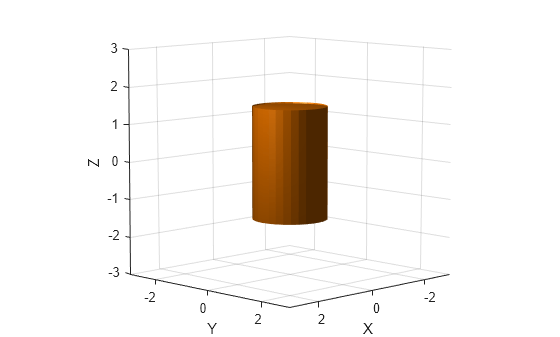
Show the cylinder in a new figure with the face color as cyan and return the patch object that represents the cylinder. You can modify other properties of the patch using the patch object, such as EdgeAlpha, EdgeColor, and LineWidth.
[~,patchObj] = show(cyl,FaceColor=[0 0 1],FaceAlpha=0.2);
patchObj.EdgeAlpha = 1;
patchObj.EdgeColor = [0 0 1];
patchObj.LineWidth = 0.1;
title("Collision Geometry")