risk.validation.areaUnderCurve
Syntax
Description
aucValue = risk.validation.areaUnderCurve(Score,BinaryResponse)Score contains numeric
values that represent quantities such as rankings or predictions, probability of default
(PD), or loss given default (LGD) estimates. For example, in credit scoring models, the
values in Score can represent individual credit scores or other credit
data. BinaryResponse specifies the target state of each value in
Score.
aucValue = risk.validation.areaUnderCurve(Score,BinaryResponse,SortDirection=sortdir)Score.
Examples
Compute the area under the curve of credit scores by using the areaUnderCurve function with a credit validation data set contained in creditValidationData.mat. This data set includes a table, ScorecardValidationData, that contains credit scores and their corresponding default status.
Load the credit validation data and display the scores.
load CreditValidationData.mat
head(ScorecardValidationData)
CreditScore PD Default
___________ _______ _______
579.86 0.14182 0
563.65 0.17143 0
549.52 0.20106 0
546.25 0.20845 0
485.34 0.37991 0
482.07 0.39065 0
579.86 0.14182 1
451.73 0.494 0
Extract the variables CreditScore and Default from the table ScorecardValidationData. Use Default as the BinaryResponse input argument.
Scores = ScorecardValidationData.CreditScore;
BinaryResponse = ScorecardValidationData.Default;
Compute the area under the curve of the credit scores by using the areaUnderCurve function with the fully qualified namespace risk.validation. For credit models, you can sort the scores from lower scores to higher scores by setting the SortDirection name-value argument to "ascending". This setting ensures that the function sorts the scores from higher risk individuals to lower risk individuals.
[aucValue,Output] = risk.validation.areaUnderCurve(Scores,BinaryResponse,SortDirection="ascending")aucValue = 0.6078
Output = struct with fields:
          AreaUnderCurve: 0.6078
    AUCStandardDeviation: 0.0314
                 Metrics: [107×3 table]
The output argument aucValue contains the AUC value. Display the metrics Threshold, TruePositiveRate, and FalsePositiveRate contained in the table Output.Metrics.
head(Output.Metrics)
    Threshold    TruePositiveRate    FalsePositiveRate
    _________    ________________    _________________

     408.99                 0                   0
     408.99          0.071429            0.012821
     410.12          0.079365            0.017094
     430.66          0.087302            0.017094
     435.52          0.087302            0.025641
     436.65           0.10317            0.029915
     439.33           0.11905            0.029915
     440.45           0.13492            0.029915
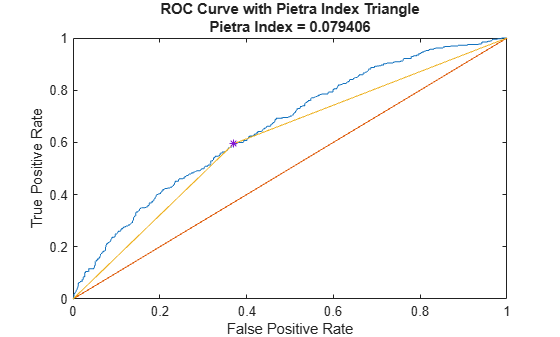
Compute the Pietra Index using a credit card data set and visualize the corresponding triangle under the receiver operating characteristic (ROC) curve.
Load credit scorecard data.
load CreditCardData.mat
sc = creditscorecard(data,"IDVar","CustID");
sc = autobinning(sc);
sc = fitmodel(sc,'Display','off');
Because the Pietra index is equivalent to the Kolmogorov–Smirnov (KS) metric, you can compute the index by using the risk.validation.kolmogorovSmirnov function to calculate the KS metric. Use the probability of default (PD) as the model prediction and the default indicator as the binary response.
PD = probdefault(sc,data);
Response = data.status;
[ksValue,ksOutput] = risk.validation.kolmogorovSmirnov(PD,Response)
ksValue =
0.2246
ksOutput = struct with fields:
    KolmogorovSmirnovStatistic: 0.2246
        KolmogorovSmirnovScore: 0.3345
                       Metrics: [969×3 table]
Calculate the Pietra index by multiplying the KS metric by sqrt(2)/4.
PietraIndex = ksValue*sqrt(2)/4
PietraIndex =
0.0794
The Pietra index corresponds to the maximum area of a triangle inscribed between the ROC curve and the diagonal of the unit square. Use the following code to visualize the location of this triangle.
figure;
plot(ksOutput.Metrics.FalsePositiveRate,ksOutput.Metrics.TruePositiveRate)
hold on
plot([0 1],[0 1])
ksIndex = ksOutput.Metrics.Threshold==ksOutput.KolmogorovSmirnovScore;
PietraCoordinates = [ksOutput.Metrics.FalsePositiveRate(ksIndex)
ksOutput.Metrics.TruePositiveRate(ksIndex)];
plot([0 PietraCoordinates(1) 1],[0 PietraCoordinates(2) 1])
plot(PietraCoordinates(1),PietraCoordinates(2),'*')
hold off
xlabel('False Positive Rate')
ylabel('True Positive Rate')
title(["ROC Curve with Pietra Index Triangle"; "Pietra Index = " + PietraIndex])
For additional information, see [1].
Input Arguments
Output Arguments
References
[1] Basel Committee on Banking Supervision, “Studies on the Validation of the Internal Rating Systems.” May, 2005. https://www.bis.org/publ/bcbs_wp14.htm.
Version History
Introduced in R2025a