Main Content

plotCoverage

R2026b

Plot set of beams and scan limits in theater coverage plotter

Description

plotCoverage(cPlotter,configurations) specifies configurations of M sensors or emitters whose scan limits and beams are plotted by the CoveragePlotter object, cPlotter. See coveragePlotter on how to create a CoveragePlotter object.

example

plotCoverage(cPlotter,configurations,indices,colors) specifies the color of each coverage and beam plot pair using a list of indices and colors.

Examples

collapse all

Create a theater plot and set the limits for its axes. Create a coverage plotter with DisplayName set to 'Sensor Coverage'.

tp = theaterPlot('XLim',[-40 40],'YLim',[-40 40],'ZLim',[-40 40]);
covp = coveragePlotter(tp,'DisplayName','Sensor Coverage');

Set up the configuration of the sensors whose coverage is to be plotted.

 sensor = struct('Index',1,'ScanLimits',[-45 45],'FieldOfView',[10;40],...
       'LookAngle',-10,'Range',30,'Position',zeros(1,3),'Orientation',zeros(1,3));

Plot the coverage using the plotCoverage function and visualize the results. The dark blue represents the current sensor beam, and the light blue represents the coverage area.

plotCoverage(covp,sensor)
view(70,30)
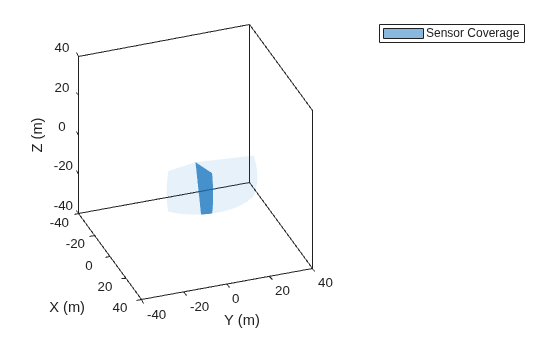
Figure contains an axes object. The axes object with xlabel X (m), ylabel Y (m) contains an object of type patch. This object represents Sensor Coverage.

Create a theater plot and create a coverage plotter.

tp = theaterPlot('XLim',[-1e7 1e7],'YLim',[-1e7 1e7],'ZLim',[-2e6 1e6]);
covp = coveragePlotter(tp,'DisplayName','Sensor Coverage');
view(25,20)

Model a non-scanning radar and a raster scanning radar.

radarIndex = 1;
radar =fusionRadarSensor(radarIndex,'No Scanning','RangeLimits',[0 1e8]);
RasterIndex = 2;
raster = fusionRadarSensor(RasterIndex,'Raster','RangeLimits',[0 1e8]);

Create a target platform.

tgt = struct( ...
        'PlatformID', 1, ...
        'Position', [0 -50e3 -1e3], ...
        'Speed', -1e3);

Simulate sensors and visualize their scanning pattern.

time = 0;
timestep = 1;
stopTime = 90;
while time < stopTime
    time = time+timestep;
    radar(tgt,time);
    raster(tgt,time);
    
    % Obtain sensor configuration using coverageConfig. 
    radarcov = coverageConfig(radar);
    ircov = coverageConfig(raster);
    
    % Update plotter
    plotCoverage(covp,[radarcov,ircov],... 
        [radarIndex, RasterIndex],... 
        {'blue','red'}... 
        );
    pause(0.03)
end
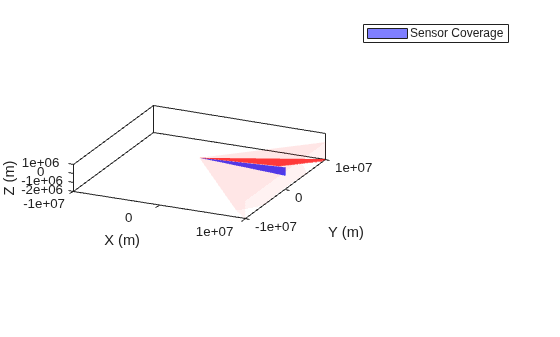
Figure contains an axes object. The axes object with xlabel X (m), ylabel Y (m) contains an object of type patch. This object represents Sensor Coverage.

Input Arguments

collapse all

Coverage plotter object, created by the coveragePlotter function.

Coverage configurations, specified as an array of structures. Each structure contains these fields:

Fields of configurations

FieldDescription
Index A unique integer to distinguish sensors or emitters.
LookAngle

Current boresight angles of the sensor or emitter, specified as:

  • A scalar in degrees if scanning only in the azimuth direction.

  • A two-element vector [azimuth; elevation] in degrees if scanning both in the azimuth and elevation directions.

FieldOfViewField of view of the sensor or emitter, specified as a two-element vector [azimuth; elevation] in degrees.
ScanLimits

Minimum and maximum angles the sensor or emitter can scan from its Orientation.

  • If the sensor or emitter can only scan in the azimuth direction, specify the limits as a 1-by-2 row vector [minAz, maxAz] in degrees. The plotCoverage function then plots the field of view in the elevation dimension.

  • If the sensor or emitter can also scan in the elevation direction, specify the limits as a 2-by-2 matrix [minAz, maxAz; minEl, maxEl] in degrees.

RangeRange of the beam and coverage area of the sensor or emitter in meters.
PositionOrigin position of the sensor or emitter, specified as a three-element vector [X, Y, Z] on the theater plot's axes.
OrientationRotation transformation from the scenario or global frame to the sensor or emitter mounting frame, specified as a rotation matrix, a quaternion, or three Euler angles in ZYX sequence.

You can use the coverageConfig (Sensor Fusion and Tracking Toolbox) function to generate coverage configurations.

Tip

If either the value of Position field or the value of the Orientation field is NaN, the corresponding coverage area and beam will not be plotted.

Sensor or emitter indices, specified as an N-element array of nonnegative integers. This argument allows you to specify the color of each coverage area and beam pair with the corresponding index.

Example: [1;2;4]

Coverage plotter colors, specified as an N-element vector of character vectors, string scalars, RGB triplets, or hexadecimal color codes. N is the number of elements in the indices array. The coverage area and beam pair indexed by the ith element in the indices array is plotted with the color specified by the ith element of the colors array.

Version History

Introduced in R2021a