swarmchart3
3-D swarm scatter chart
Syntax
Description
Vector Data
swarmchart3(
displays a 3-D swarm chart, which is a scatter plot with the points offset (jittered) in
the x,y,z)x- and y-dimensions. The points form distinct
shapes, and the outline of each shape is similar to a violin plot. 3-D swarm charts help
you to visualize discrete (x,y) data with the
distribution of the z data. At each
(x,y) location, the points are jittered based on
the kernel density estimate of z.
swarmchart3(
specifies the marker colors. To plot all the markers with the same color, specify
x,y,z,sz,c)c as a color name or an RGB triplet. To assign a different color to
each marker, specify a vector the same size as x, y,
and z. Alternatively, you can specify a three-column matrix of RGB
triplets. The number of rows in the matrix must match the length of x,
y, and z.
swarmchart3(___, specifies a
different marker than the default marker, which is a circle. Specify
mkr)mkr after all the arguments in any of the previous syntaxes.
Table Data
swarmchart3(
plots the variables tbl,xvar,yvar,zvar)xvar, yvar, and
zvar from the table tbl. To plot one data set,
specify one variable each for xvar, yvar, and
zvar. To plot multiple data sets, specify multiple variables for at
least one of those arguments. The arguments that specify multiple variables must specify
the same number of variables.
Additional Options
swarmchart3( displays the
swarm chart in the target axes. Specify the axes before all the arguments in any of the
previous syntaxes.ax,___)
swarmchart3(___,
specifies additional properties for the swarm chart using one or more
Name,Value)Name,Value arguments. For example:
swarmchart3(x,y,z,'LineWidth',2)creates a swarm chart with 2-point marker outlines.swarmchart3(tbl,'MyX','MyY','MyZ','ColorVariable','MyColors')creates a swarm chart from data in a table, and customizes the marker colors using data from the table.
For a list of properties, see Scatter Properties.
s = swarmchart3(___) returns the
Scatter object. Use s to modify properties of the
chart after creating it. For a list of properties, see Scatter Properties.
Examples
Read the BicycleCounts.csv data set into a timetable called tbl. This data set contains bicycle traffic data over a period of time. Display the first five rows of tbl.
tbl = readtable("BicycleCounts.csv");
tbl(1:5,:)ans=5×5 table
Timestamp Day Total Westbound Eastbound
___________________ _____________ _____ _________ _________
2015-06-24 00:00:00 {'Wednesday'} 13 9 4
2015-06-24 01:00:00 {'Wednesday'} 3 3 0
2015-06-24 02:00:00 {'Wednesday'} 1 1 0
2015-06-24 03:00:00 {'Wednesday'} 1 1 0
2015-06-24 04:00:00 {'Wednesday'} 1 1 0
Create a vector x with the day name from each observation.
daynames = ["Sunday" "Monday" "Tuesday" "Wednesday" "Thursday" "Friday" "Saturday"];
x = categorical(tbl.Day,daynames);
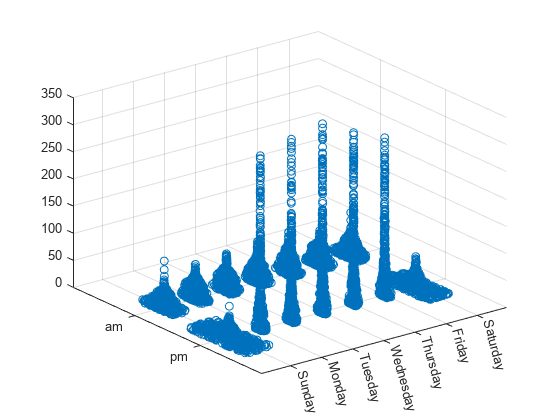
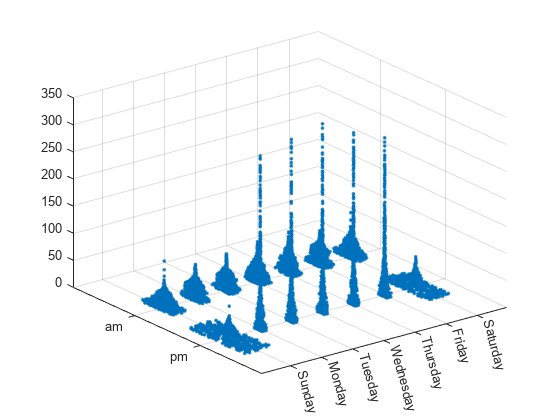
Create a categorical vector y containing the values "pm" or "am" according to the time for each observation in the table. Create vector z of eastbound traffic data. Then create a swarm chart of x, y, and z. The chart shows the data distributions for each morning and evening of the week.
ispm = tbl.Timestamp.Hour < 12;
y = categorical;
y(ispm) = "pm";
y(~ispm) = "am";
z= tbl.Eastbound;
swarmchart3(x,y,z);
Create vector x as a combination of zeros and ones, and create y as a vector containing all ones. Create z as a vector of squared random numbers. Then create a swarm chart of x, y, and z, and specify the size marker size as 5.
x = [zeros(1,500) ones(1,500)];
y = ones(1,1000);
z = randn(1,1000).^2;
swarmchart3(x,y,z,5);
Create vector x as a combination of zeros and ones, and create y as a vector containing all ones. Create z as a vector of squared random numbers. Then create a swarm chart of x, y, and z, and specify the point ('.') marker symbol.
x = [zeros(1,500) ones(1,500)];
y = ones(1,1000);
z = randn(1,1000).^2;
swarmchart3(x,y,z,'.');
Create vector x containing a combination of zeros and ones, and create y containing a random combination of ones and twos. Create z as a vector of squared random numbers. Specify the colors for the markers by creating vector c as the square root of z. Then create a swarm chart of x, y, and z. Set the marker size to 50 and specify the colors as c. The values in c index into the figure's colormap. Use the 'filled' option to fill the markers with color instead of displaying them as hollow circles.
x = [zeros(1,500) ones(1,500)];
y = randi(2,1,1000);
z = randn(1,1000).^2;
c = sqrt(z);
swarmchart3(x,y,z,50,c,'filled');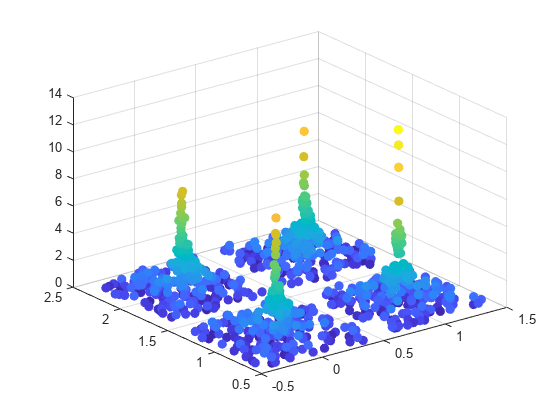
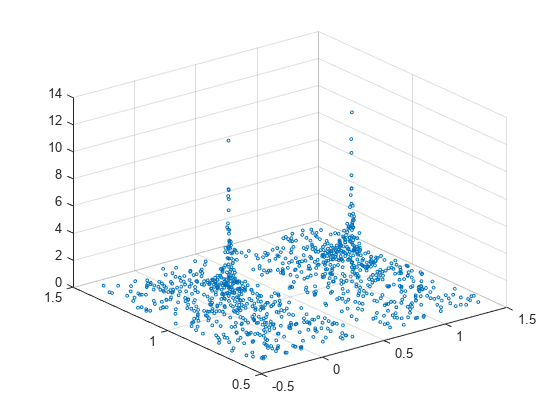
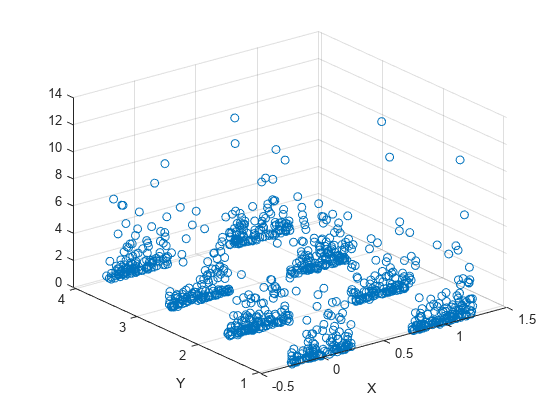
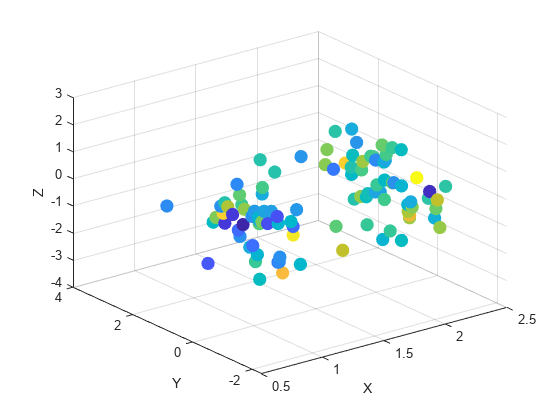
Create vector x containing a combination of zeros and ones, and create y containing a random combination of the numbers one through four. Create z as a vector of squared random numbers. Then create a swarm chart of x, y, and z by calling the swarmchart function with a return argument that stores the Scatter object. Add x- and y-axis labels so you can see the effect of changing the jitter properties in each dimension.
x = [zeros(1,500) ones(1,500)];
y = randi(4,1,1000);
z = randn(1,1000).^2;
s = swarmchart3(x,y,z);
xlabel('X')
ylabel('Y')
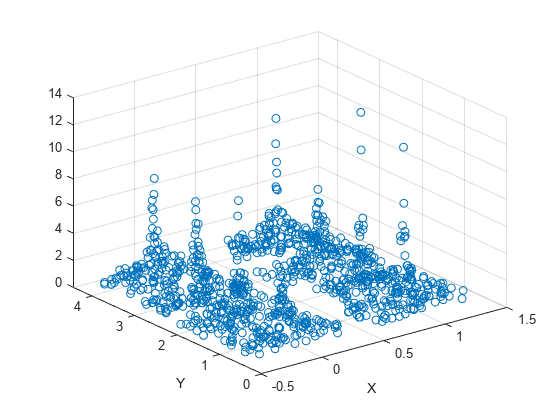
Change the shapes of the clusters of points by setting the jitter properties on the Scatter object. In the x dimension, specify uniform random jitter, and change the jitter width to 0.5 data units. In the y dimension, specify normal random jitter, and change the jitter width to 0.1 data units. The spacing between points does not exceed the jitter width you specify.
s.XJitter = 'rand';
s.XJitterWidth = 0.5;
s.YJitter = 'randn';
s.YJitterWidth = 0.1;
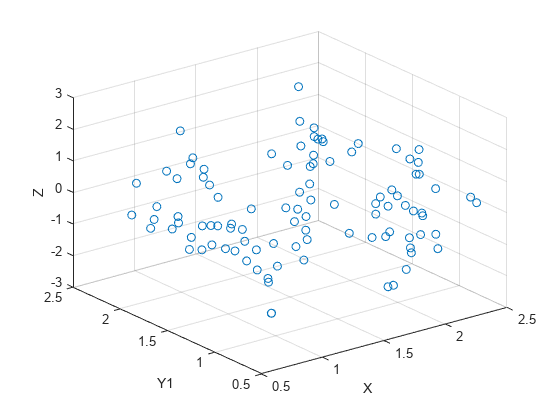
A convenient way to plot data from a table is to pass the table to the swarm3 function and specify the variables you want to plot. For example, create a table with four variables of random numbers, and plot the X, Y1, and Z variables. By default, the axis labels match the variable names.
tbl = table(randi(2,100,1),randi(2,100,1),randi([10 11],100,1), ...
   randn(100,1),'VariableNames',{'X','Y1','Y2','Z'});

swarmchart3(tbl,'X','Y1','Z')
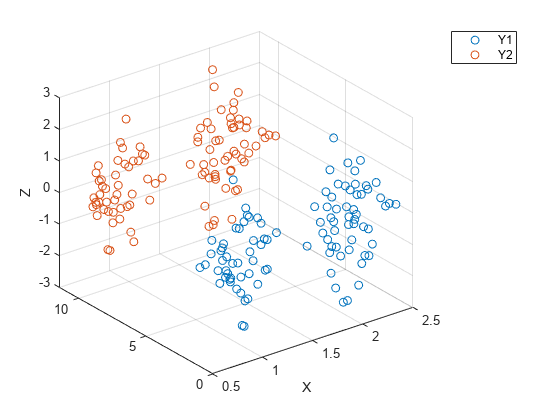
You can also plot multiple variables at the same time. For example, plot Y1 and Y2 on the y-axis by specifying the yvar argument as the cell array {'Y1','Y2'}. Then add a legend. The legend labels match the variable names.
swarmchart3(tbl,'X',{'Y1','Y2'},'Z')
legend
One way to plot data from a table and customize the colors and marker sizes is to set the ColorVariable and SizeData properties. You can set these properties as name-value arguments when you call the swarmchart3 function, or you can set them on the Scatter object later.
For example, create a table with four variables of random numbers, and plot the X, Y, and Z variables with filled markers. Vary the marker colors by specifying the ColorVariable name-value argument. Return the Scatter object as s, so you can set other properties later.
tbl = table(randi(2,100,1),randn(100,1),randn(100,1),randn(100,1), ...
   'VariableNames',{'X','Y','Z','Colors'});

s = swarmchart3(tbl,'X','Y','Z','filled','ColorVariable','Colors');
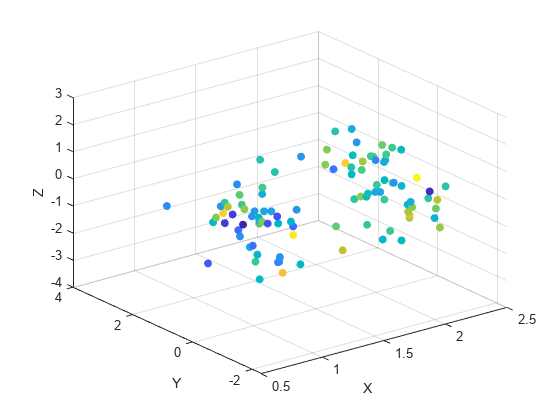
Change the marker sizes to 100 points by setting the SizeData property.
s.SizeData = 100;
Read the BicycleCounts.csv data set into a timetable called tbl. This data set contains bicycle traffic data over a period of time. Display the first five rows of tbl.
tbl = readtable("BicycleCounts.csv");
tbl(1:5,:)ans=5×5 table
Timestamp Day Total Westbound Eastbound
___________________ _____________ _____ _________ _________
2015-06-24 00:00:00 {'Wednesday'} 13 9 4
2015-06-24 01:00:00 {'Wednesday'} 3 3 0
2015-06-24 02:00:00 {'Wednesday'} 1 1 0
2015-06-24 03:00:00 {'Wednesday'} 1 1 0
2015-06-24 04:00:00 {'Wednesday'} 1 1 0
Create vector x with the days names for each observation. Create a categorical vector y containing the values "pm" or "am" according to the time for each observation in the table. Define ze as a vector of eastbound traffic data, and define zw as a vector of westbound traffic data.
daynames = ["Sunday" "Monday" "Tuesday" "Wednesday" "Thursday" "Friday" "Saturday"];
x = categorical(tbl.Day,daynames);
ispm = tbl.Timestamp.Hour<12;
y = categorical;
y(ispm) = 'pm';
y(~ispm) = 'am';
ze = tbl.Eastbound;
zw = tbl.Westbound;
Create a tiled chart layout in the 'flow' tile arrangement, so that the axes fill the available space in the layout. Call the nexttile function to create an axes object and return it as ax1. Then create a swarm chart of the eastbound data by passing ax1 to the swarmchart function.
tiledlayout('flow')
ax1=nexttile;
swarmchart3(ax1,x,y,ze,'.');
Repeat the process to create a second axes object and a swarm chart for the westbound traffic.
ax2 = nexttile;
z = tbl.Westbound;
swarmchart3(ax2,x,y,zw,'.');
Input Arguments
x-coordinates, specified as a numeric scalar or a vector the same
size as y and z.
Data Types: single | double | int8 | int16 | int32 | int64 | uint8 | uint16 | uint32 | uint64 | categorical
y-coordinates, specified as a numeric scalar or a vector the same
size as x and z.
Data Types: single | double | int8 | int16 | int32 | int64 | uint8 | uint16 | uint32 | uint64 | categorical
z-coordinates, specified as a numeric scalar or a vector the same
size as x and y.
Data Types: single | double | int8 | int16 | int32 | int64 | uint8 | uint16 | uint32 | uint64 | datetime | duration
Marker size in points, specified in one of these forms:
Numeric scalar — Plot all markers with equal size.
Row or column vector — Use different sizes for each marker. The length of
szmust equal the length ofx,y, andz.[]— Use the default size of 36 points.
Marker color, specified in one of these forms:
RGB triplet or color name — Plot all the markers with the same color. An RGB triplet is a three-element row vector whose elements specify the intensities of the red, green, and blue components of the color. The intensities must be in the range
[0,1]. Alternatively, you can specify a color name from the table below.Three column matrix of RGB triplets — Use different colors for each marker. Each row of the matrix specifies an RGB triplet color for the corresponding marker. The number of rows must equal the length of
x,y, andz.Vector — Use different colors for each marker. The values in
cindex into the current colormap, and they cover the full range of the colormap. The length ofcmust equal the length ofx,y, andz. To change the colormap, use thecolormapfunction.
| Color Name | Description | Equivalent RGB Triplet |
|---|---|---|
'red' or 'r' | Red | [1 0 0] |
'green' or 'g' | Green | [0 1 0] |
'blue' or 'b' | Blue | [0 0 1] |
'yellow' or 'y' | Yellow | [1 1 0] |
'magenta' or 'm' | Magenta | [1 0 1] |
'cyan' or 'c' | Cyan | [0 1 1] |
'white' or 'w' | White | [1 1 1] |
'black' or 'k' | Black | [0 0 0] |
Marker type, specified as one of the values listed in this table.
| Marker | Description | Resulting Marker |
|---|---|---|
"o" | Circle |
|
"+" | Plus sign |
|
"*" | Asterisk |
|
"." | Point |
|
"x" | Cross |
|
"_" | Horizontal line |
|
"|" | Vertical line |
|
"square" | Square |
|
"diamond" | Diamond |
|
"^" | Upward-pointing triangle |
|
"v" | Downward-pointing triangle |
|
">" | Right-pointing triangle |
|
"<" | Left-pointing triangle |
|
"pentagram" | Pentagram |
|
"hexagram" | Hexagram |
|
Option to fill the interior of the markers, specified as
'filled'. Use this option with markers that have a face, for example,
'o' or 'square'. Markers that do not have a face
and contain only edges do not render at all ('+',
'*', '.', and 'x').
The 'filled' option sets the MarkerFaceColor
property of the Scatter object to
'flat' and the MarkerEdgeColor property to
'none'. In this case, MATLAB® draws the marker faces, but not the edges.
Source table containing the data to plot, specified as a table or timetable.
Table variables containing the x-coordinates, specified as one or more table variable indices.
Specifying Table Indices
Use any of the following indexing schemes to specify the desired variable or variables.
| Indexing Scheme | Examples |
|---|---|
Variable names:
|
|
Variable indices:
|
|
Variable type:
|
|
Plotting Your Data
The table variables you specify can contain numeric, categorical, datetime, or duration values.
To plot one data set, specify one variable for xvar, one variable for
yvar, and one variable for zvar. For example,
create a table with four variables of normally distributed random values. Plot the
X, Y1, and Z
variables.
tbl = table(randn(100,1),randn(100,1),randn(100,1)+5,randn(100,1), ...
   'VariableNames',{'X','Y1','Y2','Z'});

swarmchart3(tbl,'X','Y1','Z')
To plot multiple data sets together, specify multiple variables for at least one of xvar, yvar, or zvar. If you specify multiple variables for more than one argument, the number of variables must be the same for each of those arguments.
For example, plot the X variable on the x-axis, the
Y1 and Y2 variables on the
y-axis, and the Z variable on the
z-axis.
swarmchart3(tbl,'X',{'Y1','Y2'},'Z')
You can also use different indexing schemes for xvar,
yvar, and zvar. For example, specify
xvar as a variable name, yvar as an index number,
and zvar as a logical
vector.
swarmchart3(tbl,'X',2,[false false true])Table variables containing the y-coordinates, specified as one or more table variable indices.
Specifying Table Indices
Use any of the following indexing schemes to specify the desired variable or variables.
| Indexing Scheme | Examples |
|---|---|
Variable names:
|
|
Variable indices:
|
|
Variable type:
|
|
Plotting Your Data
The table variables you specify can contain numeric, categorical, datetime, or duration values.
To plot one data set, specify one variable for xvar, one variable for
yvar, and one variable for zvar. For example,
create a table with four variables of normally distributed random values. Plot the
X, Y1, and Z
variables.
tbl = table(randn(100,1),randn(100,1),randn(100,1)+5,randn(100,1), ...
   'VariableNames',{'X','Y1','Y2','Z'});

swarmchart3(tbl,'X','Y1','Z')
To plot multiple data sets together, specify multiple variables for at least one of xvar, yvar, or zvar. If you specify multiple variables for more than one argument, the number of variables must be the same for each of those arguments.
For example, plot the X variable on the x-axis, the
Y1 and Y2 variables on the
y-axis, and the Z variable on the
z-axis.
swarmchart3(tbl,'X',{'Y1','Y2'},'Z')
You can also use different indexing schemes for xvar,
yvar, and zvar. For example, specify
xvar as a variable name, yvar as an index number,
and zvar as a logical
vector.
swarmchart3(tbl,'X',2,[false false true])Table variables containing the z-coordinates, specified as one or more table variable indices.
Specifying Table Indices
Use any of the following indexing schemes to specify the desired variable or variables.
| Indexing Scheme | Examples |
|---|---|
Variable names:
|
|
Variable indices:
|
|
Variable type:
|
|
Plotting Your Data
The table variables you specify can contain numeric, categorical, datetime, or duration values.
To plot one data set, specify one variable for xvar, one variable for
yvar, and one variable for zvar. For example,
create a table with four variables of normally distributed random values. Plot the
X, Y1, and Z
variables.
tbl = table(randn(100,1),randn(100,1),randn(100,1)+5,randn(100,1), ...
   'VariableNames',{'X','Y1','Y2','Z'});

swarmchart3(tbl,'X','Y1','Z')
To plot multiple data sets together, specify multiple variables for at least one of xvar, yvar, or zvar. If you specify multiple variables for more than one argument, the number of variables must be the same for each of those arguments.
For example, plot the X variable on the x-axis, the
Y1 and Y2 variables on the
y-axis, and the Z variable on the
z-axis.
swarmchart3(tbl,'X',{'Y1','Y2'},'Z')
You can also use different indexing schemes for xvar,
yvar, and zvar. For example, specify
xvar as a variable name, yvar as an index number,
and zvar as a logical
vector.
swarmchart3(tbl,'X',2,[false false true])Target axes, specified as an Axes object. If you do not specify
the axes, MATLAB plots into the current axes, or it creates an Axes
object if one does not exist.
Name-Value Arguments
Algorithms
The points in a swarm chart are jittered using uniform random values that are weighted by
the Gaussian kernel density estimate of z and the relative number of points
at each (x, y) location. This behavior corresponds to
the default 'density' setting of the XJitter and
YJitter properties on the Scatter object when you call
the swarmchart3 function.
The maximum spread of points at each x
location is 90% of the smallest distance between adjacent points by default. For example, in
the x dimension, the spread is calculated
as:
spread = 0.9 * min(diff(unique(x)));
You can control the offset by setting the XJitterWidth and
YJitterWidth properties on the Scatter object.
Version History
Introduced in R2020bWhen you pass a table and one or more variable names to the swarmchart3 function, the axis and legend labels now display any special characters that are included in the table variable names, such as underscores. Previously, special characters were interpreted as TeX or LaTeX characters.
For example, if you pass a table containing a variable named Sample_Number
to the swarmchart3 function, the underscore appears in the axis and
legend labels. In R2022a and earlier releases, the underscores are interpreted as
subscripts.
| Release | Label for Table Variable "Sample_Number" |
|---|---|
R2022b |
|
R2022a |
|
To display axis and legend labels with TeX or LaTeX formatting, specify the labels manually.
For example, after plotting, call the xlabel or
legend function with the desired label strings.
xlabel("Sample_Number")
legend(["Sample_Number" "Another_Legend_Label"])