polaraxes
Create polar axes
Description
polaraxes creates the default polar axes in the current
figure.
polaraxes( specifies
properties for the Name,Value)PolarAxes object using one
or more name-value pair arguments, for example,
'ThetaDir','clockwise'. For a list of properties, see
PolarAxes Properties.
polaraxes(
creates the polar axes in the figure, panel, or tab specified by
parent,___)parent, instead of in the current figure. Use this option
alone or with name-value pair arguments.
returns
the pax = polaraxes(___)PolarAxes object created. Use
pax to query and set properties of the PolarAxes object after it is created. For a list
of properties, see PolarAxes Properties.
Examples
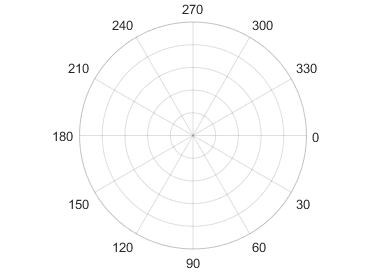
Create a new figure with polar axes and assign the polar axes object to pax. Add a plot to the axes. Then, use pax to modify axes properties.
figure
pax = polaraxes;
theta = 0:0.01:2*pi;
rho = sin(2*theta).*cos(2*theta);
polarplot(theta,rho)
pax.ThetaDir = 'clockwise';
pax.FontSize = 12;
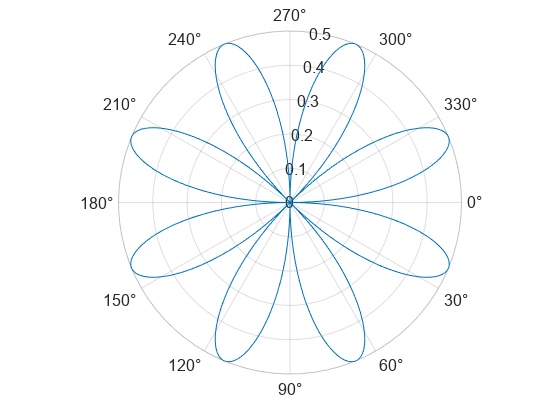
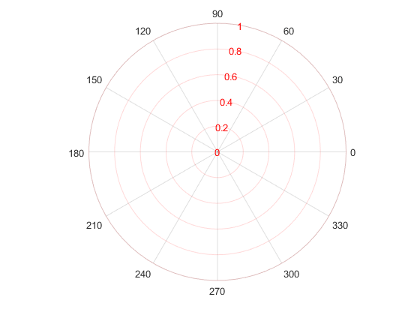
Before R2022a, polar axes do not include degree symbols by default. To add them, get the polar axes using pax = gca. Then modify the tick labels using pax.ThetaTickLabel = string(pax.ThetaTickLabel) + char(176).
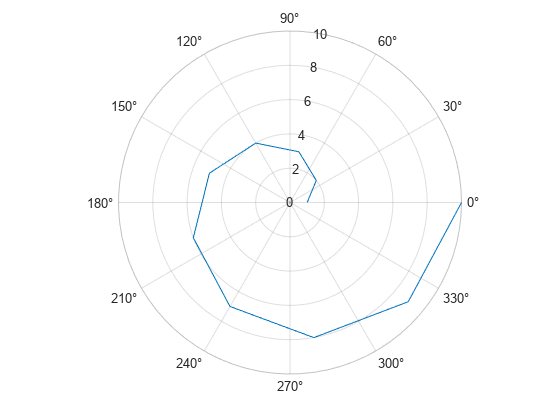
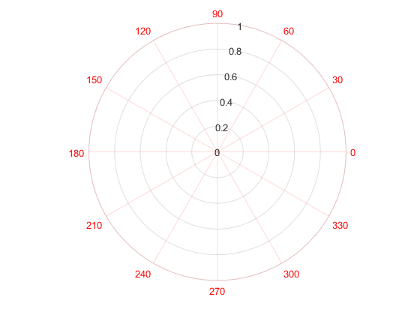
Create a figure with polar axes and assign the polar axes object to pax. Then, ensure pax is the current axes before calling the polarplot function.
figure pax = polaraxes; polaraxes(pax) polarplot(1:10)

Input Arguments
Parent container, specified as a Figure, Panel,
Tab, TiledChartLayout, or GridLayout object.
Polar axes to make current, specified as a PolarAxes object.
Name-Value Arguments
Specify optional pairs of arguments as
Name1=Value1,...,NameN=ValueN, where Name is
the argument name and Value is the corresponding value.
Name-value arguments must appear after other arguments, but the order of the
pairs does not matter.
Before R2021a, use commas to separate each name and value, and enclose
Name in quotes.
Example: 'ThetaZeroLocation','top','ThetaDir','clockwise'
The properties listed here are only a subset. For a complete list, see PolarAxes Properties. Some graphics functions reset axes properties when plotting. To avoid graphics functions from overriding the property values, set axes properties after plotting.
Units for angle values, specified as one of these values:
'degrees'— Label the angles in degrees, and interpret theThetaLim,ThetaTick, andRAxisLocationproperty values in degrees. When you switch the units from radians to degrees, MATLAB® converts the radian values in those three properties to the equivalent degree values.'radians'— Label the angles in radians, and interpret theThetaLim,ThetaTick, andRAxisLocationproperty values in radians. When you switch the units from degrees to radians, MATLAB converts the degree values in those three properties to the equivalent radian values.
Example: ax.ThetaAxisUnits = 'radians';
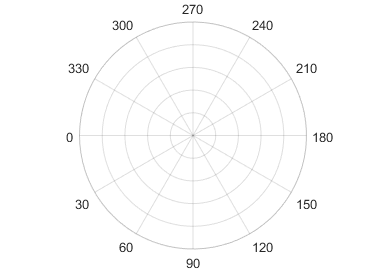
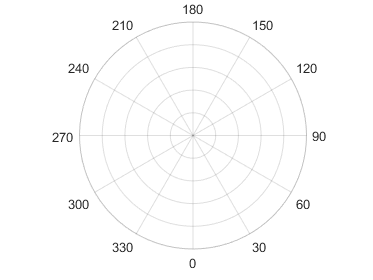
Location of the zero reference axis, specified as "right",
"top", "left", "bottom", or
an angle value. If you specify an angle value, be sure to a specify the value in degrees
or radians, according to the ThetaAxisUnits property. By default,
the ThetaAxisUnits property is set to "degrees".
| Value | Result |
|---|---|
"right" |
|
"top" |
|
"left" |
|
"bottom" |
|
45 |
|
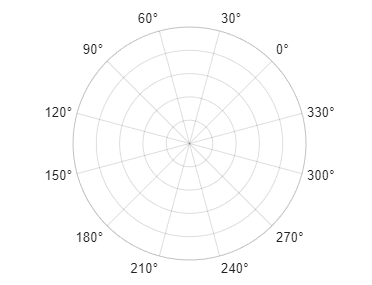
Example: polaraxes(ThetaZeroLocation="left")
Example: polaraxes(ThetaZeroLocation=45)
Direction of increasing angles, specified as one of the values in this table.
| Value | Result |
|---|---|
'counterclockwise' | Angles increase in a counterclockwise direction.
|
'clockwise' | Angles increase in a clockwise direction.
|
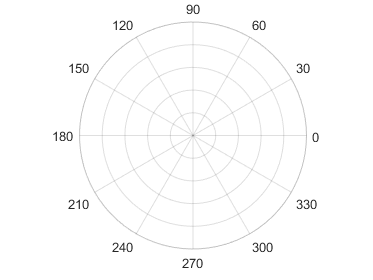
Example: ax.ThetaDir = 'clockwise';
Minimum and maximum angle values, specified as a two-element
vector of the form [thmin thmax]. If the difference
between the values is less than 360 degrees, then the theta-axis is
a partial circle.
MATLAB interprets the values in units determined by the ThetaAxisUnits property.
Example: ax.ThetaLim = [0 180];
Angles at which to display lines extending from the origin,
specified as a vector of increasing values. MATLAB labels the
lines with the appropriate angle values, unless you specify different
labels using the ThetaTickLabel property.
MATLAB interprets the values in units determined by the ThetaAxisUnits property.
Example: ax.ThetaTick = [0 90 180 270];
Alternatively, specify the values using the thetaticks function.
Color of the theta-axis, including the theta-axis grid lines, tick marks, tick labels. Specify this value as an RGB triplet, a hexadecimal color code, a color name, or a short name.
Note
If you specify the GridColor property, then the grid lines use
the color in the GridColor property instead. See GridColorMode for more
information.
For a custom color, specify an RGB triplet or a hexadecimal color code.
An RGB triplet is a three-element row vector whose elements specify the intensities of the red, green, and blue components of the color. The intensities must be in the range
[0,1], for example,[0.4 0.6 0.7].A hexadecimal color code is a string scalar or character vector that starts with a hash symbol (
#) followed by three or six hexadecimal digits, which can range from0toF. The values are not case sensitive. Therefore, the color codes"#FF8800","#ff8800","#F80", and"#f80"are equivalent.
Alternatively, you can specify some common colors by name. This table lists the named color options, the equivalent RGB triplets, and the hexadecimal color codes.
| Color Name | Short Name | RGB Triplet | Hexadecimal Color Code | Appearance |
|---|---|---|---|---|
"red" | "r" | [1 0 0] | "#FF0000" |
|
"green" | "g" | [0 1 0] | "#00FF00" |
|
"blue" | "b" | [0 0 1] | "#0000FF" |
|
"cyan"
| "c" | [0 1 1] | "#00FFFF" |
|
"magenta" | "m" | [1 0 1] | "#FF00FF" |
|
"yellow" | "y" | [1 1 0] | "#FFFF00" |
|
"black" | "k" | [0 0 0] | "#000000" |
|
"white" | "w" | [1 1 1] | "#FFFFFF" |
|
"none" | Not applicable | Not applicable | Not applicable | No color |
This table lists the default color palettes for plots in the light and dark themes.
| Palette | Palette Colors |
|---|---|
Before R2025a: Most plots use these colors by default. |
|
|
|
You can get the RGB triplets and hexadecimal color codes for these palettes using the orderedcolors and rgb2hex functions. For example, get the RGB triplets for the "gem" palette and convert them to hexadecimal color codes.
RGB = orderedcolors("gem");
H = rgb2hex(RGB);Before R2023b: Get the RGB triplets using RGB =
get(groot,"FactoryAxesColorOrder").
Before R2024a: Get the hexadecimal color codes using H =
compose("#%02X%02X%02X",round(RGB*255)).
For example, ax.ThetaColor = 'r' changes the color to red.

Location of the r-axis, specified a scalar angle value. MATLAB interprets
the values in units determined by the ThetaAxisUnits property.
Example: ax.RAxisLocation = 90;
Direction of increasing values along the r-axis, specified as one of these values:
'normal'— Values increase outward from the center of the chart. The radius at the origin corresponds to the minimum value stored in theRLimproperty (typically 0).'reverse'— Values decrease outward from the center of the chart. The radius at the origin corresponds to the maximum value stored in theRLimproperty.
Example: ax.RDir = 'reverse';
Minimum and maximum radius limits, specified as a two-element
vector of the form [rmin rmax], where rmax is
a numeric value greater than rmin. You can specify
both limits, or specify one limit and let the axes automatically calculate
the other.
To automatically set the minimum limit to the minimum data value, specify the first element as
-inf, for example,[-inf 0].To automatically set the maximum limit to the maximum data value, specify the second element as
inf, for example,[0 inf].
Alternatively, use the rlim function
to set the limits.
Example: ax.RLim = [0 6];
Radius tick values, specified as a vector of increasing values. The radius tick values
are the locations along the r-axis where the circular lines appear.
The radius tick labels are the labels that you see next to each line. Use the
RTickLabels property to specify the associated labels.
Example: ax.RTick = [0 2 4 6];
Alternatively, use the rticks function to specify the tick
values.
Color of the r-axis, including the r-axis grid lines, tick marks, and tick labels. Specify this value as an RGB triplet, a hexadecimal color code, a color name, or a short name.
Note
If you specify the GridColor property, then the grid lines use
the color in the GridColor property instead. See GridColorMode for more
information.
For a custom color, specify an RGB triplet or a hexadecimal color code.
An RGB triplet is a three-element row vector whose elements specify the intensities of the red, green, and blue components of the color. The intensities must be in the range
[0,1], for example,[0.4 0.6 0.7].A hexadecimal color code is a string scalar or character vector that starts with a hash symbol (
#) followed by three or six hexadecimal digits, which can range from0toF. The values are not case sensitive. Therefore, the color codes"#FF8800","#ff8800","#F80", and"#f80"are equivalent.
Alternatively, you can specify some common colors by name. This table lists the named color options, the equivalent RGB triplets, and the hexadecimal color codes.
| Color Name | Short Name | RGB Triplet | Hexadecimal Color Code | Appearance |
|---|---|---|---|---|
"red" | "r" | [1 0 0] | "#FF0000" |
|
"green" | "g" | [0 1 0] | "#00FF00" |
|
"blue" | "b" | [0 0 1] | "#0000FF" |
|
"cyan"
| "c" | [0 1 1] | "#00FFFF" |
|
"magenta" | "m" | [1 0 1] | "#FF00FF" |
|
"yellow" | "y" | [1 1 0] | "#FFFF00" |
|
"black" | "k" | [0 0 0] | "#000000" |
|
"white" | "w" | [1 1 1] | "#FFFFFF" |
|
"none" | Not applicable | Not applicable | Not applicable | No color |
This table lists the default color palettes for plots in the light and dark themes.
| Palette | Palette Colors |
|---|---|
Before R2025a: Most plots use these colors by default. |
|
|
|
You can get the RGB triplets and hexadecimal color codes for these palettes using the orderedcolors and rgb2hex functions. For example, get the RGB triplets for the "gem" palette and convert them to hexadecimal color codes.
RGB = orderedcolors("gem");
H = rgb2hex(RGB);Before R2023b: Get the RGB triplets using RGB =
get(groot,"FactoryAxesColorOrder").
Before R2024a: Get the hexadecimal color codes using H =
compose("#%02X%02X%02X",round(RGB*255)).
For example, ax.RColor = 'r' changes the color to red.

Version History
Introduced in R2016aPolar axes now display tick values in degrees with degree symbols when the
ThetaAxisUnits property is set to
"degrees".
This change clarifies which units are being used for the theta
tick values. You can use the ThetaAxisUnits property to display
the tick values in degrees or radians. To remove the degree symbols, change the tick
label format for the
theta-axis:
pax = polaraxes;
pax.ThetaAxis.TickLabelFormat = "%g";MATLAB Command
You clicked a link that corresponds to this MATLAB command:
Run the command by entering it in the MATLAB Command Window. Web browsers do not support MATLAB commands.
Select a Web Site
Choose a web site to get translated content where available and see local events and offers. Based on your location, we recommend that you select: .
You can also select a web site from the following list
How to Get Best Site Performance
Select the China site (in Chinese or English) for best site performance. Other MathWorks country sites are not optimized for visits from your location.
Americas
- América Latina (Español)
- Canada (English)
- United States (English)
Europe
- Belgium (English)
- Denmark (English)
- Deutschland (Deutsch)
- España (Español)
- Finland (English)
- France (Français)
- Ireland (English)
- Italia (Italiano)
- Luxembourg (English)
- Netherlands (English)
- Norway (English)
- Österreich (Deutsch)
- Portugal (English)
- Sweden (English)
- Switzerland
- United Kingdom (English)


