Main Content

DatetimeRuler Properties

Control axis with datetime values

DatetimeRuler properties control the appearance and behavior of an x-axis, y-axis, or z-axis that shows datetime values. Each individual axis has its own ruler object. By changing property values of the ruler, you can modify certain aspects of a specific axis.

Use dot notation to refer to a particular ruler and property. Access the ruler objects through the XAxis, YAxis, and ZAxis properties of the Axes object.

ax = gca;
co = ax.XAxis.Color;
ax.XAxis.Color = 'blue';

Appearance

expand all

Color of the axis line and labels, specified as an RGB triplet, a hexadecimal color code, a color name, or a short name.

For a custom color, specify an RGB triplet or a hexadecimal color code.

  • An RGB triplet is a three-element row vector whose elements specify the intensities of the red, green, and blue components of the color. The intensities must be in the range [0,1], for example, [0.4 0.6 0.7].

  • A hexadecimal color code is a string scalar or character vector that starts with a hash symbol (#) followed by three or six hexadecimal digits, which can range from 0 to F. The values are not case sensitive. Therefore, the color codes "#FF8800", "#ff8800", "#F80", and "#f80" are equivalent.

Alternatively, you can specify some common colors by name. This table lists the named color options, the equivalent RGB triplets, and hexadecimal color codes.

Color NameShort NameRGB TripletHexadecimal Color CodeAppearance
"red""r"[1 0 0]"#FF0000"

Sample of the color red

"green""g"[0 1 0]"#00FF00"

Sample of the color green

"blue""b"[0 0 1]"#0000FF"

Sample of the color blue

"cyan" "c"[0 1 1]"#00FFFF"

Sample of the color cyan

"magenta""m"[1 0 1]"#FF00FF"

Sample of the color magenta

"yellow""y"[1 1 0]"#FFFF00"

Sample of the color yellow

"black""k"[0 0 0]"#000000"

Sample of the color black

"white""w"[1 1 1]"#FFFFFF"

Sample of the color white

"none"Not applicableNot applicableNot applicableNo color

Here are the RGB triplets and hexadecimal color codes for the default colors MATLAB® uses in many types of plots.

RGB TripletHexadecimal Color CodeAppearance
[0 0.4470 0.7410]"#0072BD"

Sample of RGB triplet [0 0.4470 0.7410], which appears as dark blue

[0.8500 0.3250 0.0980]"#D95319"

Sample of RGB triplet [0.8500 0.3250 0.0980], which appears as dark orange

[0.9290 0.6940 0.1250]"#EDB120"

Sample of RGB triplet [0.9290 0.6940 0.1250], which appears as dark yellow

[0.4940 0.1840 0.5560]"#7E2F8E"

Sample of RGB triplet [0.4940 0.1840 0.5560], which appears as dark purple

[0.4660 0.6740 0.1880]"#77AC30"

Sample of RGB triplet [0.4660 0.6740 0.1880], which appears as medium green

[0.3010 0.7450 0.9330]"#4DBEEE"

Sample of RGB triplet [0.3010 0.7450 0.9330], which appears as light blue

[0.6350 0.0780 0.1840]"#A2142F"

Sample of RGB triplet [0.6350 0.0780 0.1840], which appears as dark red

Note

The Color property for the ruler and the associated XColor, YColor, or ZColor property for the parent axes always have the same value. Setting one also sets the other.

Width of axis line and tick marks, specified as a positive value in point units. One point equals 1/72 inch.

Example: ax.XAxis.LineWidth = 2;

Note

Setting the LineWidth property for the parent axes sets the LineWidth property for the ruler to the same value. However, setting the ruler property does not set the axes property. To prevent the axes property value from overriding the ruler property value, set the axes value first, and then set the ruler value.

Axis label, which is a text object. To display text or change existing text, set the String property for the text object. Use other properties to change the text appearance, such as the font style or color.

ax = gca;
ax.XAxis.Label.String = 'X Axis';
ax.XAxis.Label.FontSize = 12;

For a full list of options, see Text Properties.

Alternatively, add or modify the axis labels using the xlabel, ylabel, and zlabel functions.

Note

  • The text object is not a child of the ruler object, so it cannot be returned by findobj and it does not use the default text property values.

  • The text object stored in this property is the same as the text object stored in the parent object’s label property. Thus, you can modify the text object using either the ruler or the parent object’s property. For example, setting the font size on a text object stored in an x-axis ruler’s Label property is the same as setting the font size on the text object stored in the XLabel property of the parent axes.

Axis label horizontal alignment, specified as one of the values from the table.

LabelHorizontalAlignment ValueDescriptionAppearance
'center'

For a horizontal axis, the label is centered between the left and right edges of the plot box.

For a vertical axis, the label is centered between the top and bottom edges of the plot box.

Horizontal and a vertical axis labels that are centered.

'left'

For a horizontal axis, the label is aligned with the left edge of the plot box.

For a vertical axis, the label is aligned with the bottom edge of the plot box.

Horizontal and a vertical axis labels that left-aligned.

'right'

For a horizontal axis, the label is aligned with the right edge of the plot box.

For a vertical axis, the label is aligned with the top edge of the plot box.

Horizontal and a vertical axis labels that right-aligned.

Axis visibility, specified as 'on' or 'off', or as numeric or logical 1 (true) or 0 (false). A value of 'on' is equivalent to true, and 'off' is equivalent to false. Thus, you can use the value of this property as a logical value. The value is stored as an on/off logical value of type matlab.lang.OnOffSwitchState.

  • 'on' — Display the axis.

  • 'off' — Hide the axis without deleting it. You still can access properties of an invisible axis using the ruler object.

Example: ax.XAxis.Visible = 'off';

Scale and Direction

expand all

Minimum and maximum axis limits, specified as a two-element vector of the form [min max], where min and max are datetime values. For example:

t = datetime(2014,6,28) + caldays(1:10);
y = rand(1,10);
plot(t,y);
ax = gca;
ax.XAxis.Limits = [t(2) t(8)];

Alternatively, set the limits using the xlim, ylim, and zlim functions.

If you assign a value to this property, then MATLAB sets the associated mode to 'manual'.

Note

The Limits property for the ruler and the associated XLim, YLim, or ZLim property for the parent axes always have the same value. Setting one also sets the other.

Selection mode for the Limits property, specified as one of these values:

  • 'auto' — Automatically select the axis limits based on the data plotted.

  • 'manual' — Use axis limit values that you specify. To specify the axis limits, set the Limits property.

Note

The LimitsMode property for the ruler and the associated XLimMode, YLimMode, or ZLimMode property for the parent axes always have the same value. Setting one also sets the other.

Scale of values along axis, returned as 'linear'. DatetimeRuler objects do not support log scales.

Direction of increasing values, specified as one of these values:

  • 'normal' — Values increase from left to right or bottom to top.

  • 'reverse' — Values increase from right to left or top to bottom.

Note

The Direction property for the ruler and the associated XDir, YDir, or ZDir property for the parent axes always have the same value. Setting one also sets the other.

Example: ax.XAxis.Direction = 'reverse';

Since R2023a

Reference date, specified as a datetime value. This property is useful for synchronizing tick placement across different axes and for plotting data from different time zones together.

MATLAB displays plots in the time zone of the first data set you plot into the axes. To change the time zone of the plot, set the ReferenceDate property to a datetime value that has the desired time zone.

Example

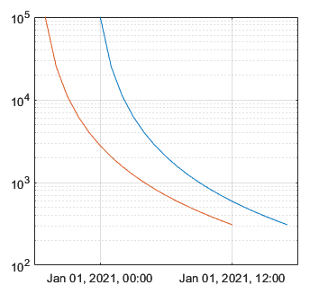
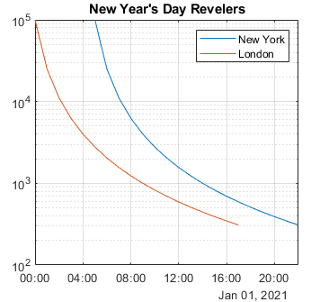
Plot the number of New Year's Day revelers in New York and London. The resulting plot is in the time zone of New York.

NY = datetime(2021,1,1,0:17,0,0,"TimeZone","America/New_York");
London = datetime(2021,1,1,0:17,0,0,"TimeZone","Europe/London");
ax = axes;
y = (1./(1:18).^2) * 100000;
semilogy(ax,NY,y,London,y)
grid on

Two data sets plotted in the time zone of New York

Change the plot to use the time zone of London by setting the ReferenceDate property to a datetime value that has a time zone of "Europe/London". Then add a legend and a title.

ax.XAxis.ReferenceDate = datetime(2022,1,1,"TimeZone","Europe/London");
legend("New York","London")
title("New Year's Day Revelers")

The same two data sets plotted in the time zone of London

Tick Values and Labels

expand all

Tick mark locations along the axis, specified as a vector of datetime values. For example:

t = datetime(2014,6,28) + caldays(1:10);
y = rand(1,10);
plot(t,y);
ax = gca;
ax.XAxis.TickValues = [t(1) t(3) t(5) t(10)];

If you assign a value to this property, then MATLAB sets the TickValuesMode property to 'manual'.

Alternatively, use the xticks, yticks, and zticks functions.

Note

The TickValues property for the ruler and the associated XTick, YTick, or ZTick property for the parent axes always have the same value. Setting one also sets the other.

Selection mode for the TickValues property, specified as one of these values:

  • 'auto' — Automatically select the tick values based on the data plotted.

  • 'manual' — Use tick values that you specify. To specify the values, set the TickValues property.

Note

The TickValuesMode property for the ruler and the associated XTickMode, YTickMode, or ZTickMode property for the parent axes always have the same value. Setting one also sets the other.

Tick mark labels, specified as a cell array of character vectors, string array, or categorical array. If you do not specify enough labels for all of the tick values, then the labels repeat. The labels support TeX and LaTeX markup. See the TickLabelInterpreter property for more information.

Example: ax.XAxis.TickLabels = {'January','February','March','April','May'}';

Example: ax.YAxis.TickLabels = {'\pi','2\pi','3\pi'}'

If you set this property, then MATLAB sets the TickLabelsMode property to 'manual'.

Alternatively, specify the tick labels using the xticklabels, yticklabels, and zticklabels functions.

Note

  • If you specify this property as a categorical array, MATLAB uses the values in the array, not the categories.

  • The TickLabels property for the ruler and the associated XTickLabel, YTickLabel, or ZTickLabel property for the parent axes always have the same value. Setting one also sets the other.

Data Types: char | string | categorical

Selection mode for the TickLabels property, specified as one of these values:

  • 'auto' — Automatically select the tick labels.

  • 'manual' — Use tick labels that you specify. To specify the labels, set the TickLabels property.

Note

The TickLabelsMode property for the ruler and the associated XTickLabelMode, YTickLabelMode, or ZTickLabelMode property for the parent axes always have the same value. Setting one also sets the other.

Tick label color, specified as an RGB triplet, a hexadecimal color code, a color name, or a short name.

For a custom color, specify an RGB triplet or a hexadecimal color code.

  • An RGB triplet is a three-element row vector whose elements specify the intensities of the red, green, and blue components of the color. The intensities must be in the range [0,1], for example, [0.4 0.6 0.7].

  • A hexadecimal color code is a string scalar or character vector that starts with a hash symbol (#) followed by three or six hexadecimal digits, which can range from 0 to F. The values are not case sensitive. Therefore, the color codes "#FF8800", "#ff8800", "#F80", and "#f80" are equivalent.

Alternatively, you can specify some common colors by name. This table lists the named color options, the equivalent RGB triplets, and hexadecimal color codes.

Color NameShort NameRGB TripletHexadecimal Color CodeAppearance
"red""r"[1 0 0]"#FF0000"

Sample of the color red

"green""g"[0 1 0]"#00FF00"

Sample of the color green

"blue""b"[0 0 1]"#0000FF"

Sample of the color blue

"cyan" "c"[0 1 1]"#00FFFF"

Sample of the color cyan

"magenta""m"[1 0 1]"#FF00FF"

Sample of the color magenta

"yellow""y"[1 1 0]"#FFFF00"

Sample of the color yellow

"black""k"[0 0 0]"#000000"

Sample of the color black

"white""w"[1 1 1]"#FFFFFF"

Sample of the color white

"none"Not applicableNot applicableNot applicableNo color

Here are the RGB triplets and hexadecimal color codes for the default colors MATLAB uses in many types of plots.

RGB TripletHexadecimal Color CodeAppearance
[0 0.4470 0.7410]"#0072BD"

Sample of RGB triplet [0 0.4470 0.7410], which appears as dark blue

[0.8500 0.3250 0.0980]"#D95319"

Sample of RGB triplet [0.8500 0.3250 0.0980], which appears as dark orange

[0.9290 0.6940 0.1250]"#EDB120"

Sample of RGB triplet [0.9290 0.6940 0.1250], which appears as dark yellow

[0.4940 0.1840 0.5560]"#7E2F8E"

Sample of RGB triplet [0.4940 0.1840 0.5560], which appears as dark purple

[0.4660 0.6740 0.1880]"#77AC30"

Sample of RGB triplet [0.4660 0.6740 0.1880], which appears as medium green

[0.3010 0.7450 0.9330]"#4DBEEE"

Sample of RGB triplet [0.3010 0.7450 0.9330], which appears as light blue

[0.6350 0.0780 0.1840]"#A2142F"

Sample of RGB triplet [0.6350 0.0780 0.1840], which appears as dark red

Note

Setting the ruler’s Color property also sets the TickLabelColor property to the same value. However, setting the TickLabelColor property does not change the Color property. To prevent the Color property value from overriding the TickLabelColor property value, set the Color property first, and then set the TickLabelColor property.

Tick label interpreter, specified as one of these values:

  • 'tex' — Interpret characters using a subset of TeX markup.

  • 'latex' — Interpret characters using LaTeX markup. When you specify the tick labels, use dollar signs around each element in the cell array.

  • 'none' — Display literal characters.

Note

Setting the TickLabelInterpreter property for the parent axes sets the TickLabelInterpreter property for the ruler to the same value. However, setting the ruler property does not set the axes property. To prevent the axes property value from overriding the ruler property value, set the axes value first, and then set the ruler value.

TeX Markup

By default, MATLAB supports a subset of TeX markup. Use TeX markup to add superscripts and subscripts, modify the text type and color, and include special characters in the text.

Modifiers remain in effect until the end of the text. Superscripts and subscripts are an exception because they modify only the next character or the characters within the curly braces. When you set the interpreter to 'tex', the supported modifiers are as follows.

ModifierDescriptionExample
^{ }Superscript'text^{superscript}'
_{ }Subscript'text_{subscript}'
\bfBold font'\bf text'
\itItalic font'\it text'
\slOblique font (usually the same as italic font)'\sl text'
\rmNormal font'\rm text'
\fontname{specifier}Font name — Replace specifier with the name of a font family. You can use this in combination with other modifiers.'\fontname{Courier} text'
\fontsize{specifier}Font size —Replace specifier with a numeric scalar value in point units.'\fontsize{15} text'
\color{specifier}Font color — Replace specifier with one of these colors: red, green, yellow, magenta, blue, black, white, gray, darkGreen, orange, or lightBlue.'\color{magenta} text'
\color[rgb]{specifier}Custom font color — Replace specifier with a three-element RGB triplet.'\color[rgb]{0,0.5,0.5} text'

This table lists the supported special characters for the 'tex' interpreter.

Character SequenceSymbolCharacter SequenceSymbolCharacter SequenceSymbol

\alpha

α

\upsilon

υ

\sim

~

\angle

\phi

ϕ

\leq

\ast

*

\chi

χ

\infty

\beta

β

\psi

ψ

\clubsuit

\gamma

γ

\omega

ω

\diamondsuit

\delta

δ

\Gamma

Γ

\heartsuit

\epsilon

ϵ

\Delta

Δ

\spadesuit

\zeta

ζ

\Theta

Θ

\leftrightarrow

\eta

η

\Lambda

Λ

\leftarrow

\theta

θ

\Xi

Ξ

\Leftarrow

\vartheta

ϑ

\Pi

Π

\uparrow

\iota

ι

\Sigma

Σ

\rightarrow

\kappa

κ

\Upsilon

ϒ

\Rightarrow

\lambda

λ

\Phi

Φ

\downarrow

\mu

µ

\Psi

Ψ

\circ

º

\nu

ν

\Omega

Ω

\pm

±

\xi

ξ

\forall

\geq

\pi

π

\exists

\propto

\rho

ρ

\ni

\partial

\sigma

σ

\cong

\bullet

\varsigma

ς

\approx

\div

÷

\tau

τ

\Re

\neq

\equiv

\oplus

\aleph

\Im

\cup

\wp

\otimes

\subseteq

\oslash

\cap

\in

\supseteq

\supset

\lceil

\subset

\int

\cdot

·

\o

ο

\rfloor

\neg

¬

\nabla

\lfloor

\times

x

\ldots

...

\perp

\surd

\prime

´

\wedge

\varpi

ϖ

\0

\rceil

\rangle

\mid

|

\vee

\langle

\copyright

©

LaTeX Markup

To use LaTeX markup, set the TickLabelInterpreter property to 'latex'. Use dollar symbols around the labels, for example, use '$\int_1^{20} x^2 dx$' for inline mode or '$$\int_1^{20} x^2 dx$$' for display mode.

The displayed text uses the default LaTeX font style. The FontName, FontWeight, and FontAngle properties do not have an effect. To change the font style, use LaTeX markup within the text. The maximum size of the text that you can use with the LaTeX interpreter is 1200 characters. For multiline text, the maximum size of the text reduces by about 10 characters per line.

For examples that use TeX and LaTeX, see Greek Letters and Special Characters in Chart Text. For more information about the LaTeX system, see The LaTeX Project website at https://www.latex-project.org/.

Tick label format, specified as a string or character vector. The default format is based on the data.

Example: ax.XAxis.TickLabelFormat = "yyyy-MM-dd"; displays a date and time such as 2014-04-19.

Example: ax.XAxis.TickLabelFormat = "eeee, MMMM d, yyyy HH:mm:ss"; displays a date and time such as Saturday, April 19, 2014 21:41:06.

Example: ax.XAxis.TickLabelFormat = "MMMM d, yyyy HH:mm:ss Z"; displays a date and time such as April 19, 2014 21:41:06 -0400.

The following tables show the letter identifiers that you can use to construct the format. To separate the fields, use nonletter characters such as a hyphen, space, colon, or any non-ASCII character. The identifiers correspond to the Unicode® Locale Data Markup Language (LDML) standard for dates.

Date and Time Formats

Use these identifiers to specify the display formats of the date and time fields.

Letter IdentifierDescriptionDisplay
GEraCE
yYear, with no leading zeros. See the Note that follows this table.2014
yyYear, using last two digits. See the Note that follows this table.14
yyy, yyyy ...Year, using at least the number of digits specified by the number of instances of 'y'For the year 2014, 'yyy' displays 2014, while 'yyyyy' displays 02014.
u, uu, ...ISO year. A single number designating the year. An ISO year value assigns positive values to CE years and negative values to BCE years, with 1 BCE being year 0.2014
QQuarter, using one digit2
QQQuarter, using two digits02
QQQQuarter, abbreviatedQ2
QQQQQuarter, full name2nd quarter
MMonth, numerical using one or two digits4
MMMonth, numerical using two digits04
MMMMonth, abbreviated nameApr
MMMMMonth, full nameApril
MMMMMMonth, capitalized first letterA
WWeek of the month1
dDay of the month, using one or two digits5
ddDay of the month using two digits05
DDay of the year, using one, two or three digits95
DDDay of the year using two digits95
DDDDay of the year using three digits095
eDay of the week, numerical using one or two digits.7, where Sunday is the first day of the week.
eeDay of the week, numerical using two digits07
eeeDay, abbreviated nameSat
eeeeDay, full nameSaturday
eeeeeDay, capitalized first letterS
aDay period (AM or PM)PM
hHour, 12-hour clock notation using one or two digits9
hhHour, 12-hour clock notation using two digits09
HHour, 24-hour clock notation using one or two digits21
HHHour, 24-hour clock notation using two digits21
mMinute, using one or two digits41
mmMinute, using two digits41
sSecond, using one or two digits6
ssSecond, using two digits06
S, SS, ..., SSSSSSSSSFractional second, using the number of digits specified by the number of instances of 'S' (up to 9 digits).'SSS' truncates 6.12345 seconds to 123.

Some tips and considerations:

  • If you read a two-digit year number and specify the format as y or yy, then the pivot year determines the century to which the year belongs.

  • Use one or more u characters instead of y characters to represent the year when working with year numbers near zero.

  • Datetime values later than 144683 years CE or before 140743 BCE display only the year numbers, regardless of the specified format value.

Time Zone Offset Formats

Use these identifiers to specify the display format of the time zone offset. A time zone offset is the amount of time that a specific date and time is offset from UTC. This is different from a time zone, which comprises rules that determine the offsets for specific times of the year. Include a time zone offset identifier when you want to ensure that the time components are displayed unambiguously.

Letter IdentifierDescriptionDisplay
zAbbreviated name of the time zone offset. If this value is not available, then the time zone offset uses the short UTC format, such as UTC-4.EDT
ZISO 8601 basic format with hours, minutes, and optional seconds fields.-0400
ZZZZLong UTC format.UTC-04:00
ZZZZZISO 8601 extended format with hours, minutes, and optional seconds fields. A time offset of zero is displayed as the ISO 8601 UTC indicator “Z”.-04:00
x or XISO 8601 basic format with hours field and optional minutes field. If you specify X, a time offset of zero is displayed as the ISO 8601 UTC indicator “Z”.-04
xx or XXISO 8601 basic format with hours and minutes fields. If you specify XX, a time offset of zero is displayed as the ISO 8601 UTC indicator “Z”.-0400
xxx or XXXISO 8601 extended format with hours and minutes fields. If you specify XXX, a time offset of zero is displayed as the ISO 8601 UTC indicator “Z”.-04:00
xxxx or XXXXISO 8601 basic format with hours, minutes, and optional seconds fields. If you specify XXXX, a time offset of zero is displayed as the ISO 8601 UTC indicator “Z”.-0400
xxxxx or XXXXXISO 8601 extended format with hours, minutes, and optional seconds fields. If you specify XXXXX, a time offset of zero is displayed as the ISO 8601 UTC indicator “Z”.-04:00

Selection mode for the TickLabelFormat property, specified as one of these values:

  • "auto" — MATLAB automatically selects a format for the tick labels based on the plotted datetime values and the SecondaryLabelFormat property.

  • "manual" — You specify the format by setting the TickLabelFormat property.

Since R2024a

Secondary label format, specified as a string scalar or character vector. The secondary label appears in the margin next to the tick labels. You can use this property to customize the format of the label. The default format is based on the data. To remove the secondary label, specify an empty string ("").

If you specify the secondary label format, the tick labels might update to avoid displaying redundant information. For example, if you plot several days and display the month in the secondary label, the tick labels update to show the day numbers without the month.

Example: ax.XAxis.SecondaryLabelFormat = "MMMM" displays the month name.

Tick labels displaying day numbers with a secondary label that displays the month name

Example: ax.XAxis.SecondaryLabelFormat = "ZZZZ" displays a time zone offset.

Tick labels displaying hours and minutes with a secondary label that displays a long UTC format time zone offset

The following tables show the letter identifiers that you can use to construct the format. To separate the fields, use nonletter characters such as a hyphen, space, colon, or any non-ASCII character. The identifiers correspond to the Unicode Locale Data Markup Language (LDML) standard for dates.

Date and Time Formats

Use these identifiers to specify the display formats of the date and time fields.

Letter IdentifierDescriptionDisplay
GEraCE
yYear, with no leading zeros. See the Note that follows this table.2014
yyYear, using last two digits. See the Note that follows this table.14
yyy, yyyy ...Year, using at least the number of digits specified by the number of instances of 'y'For the year 2014, 'yyy' displays 2014, while 'yyyyy' displays 02014.
u, uu, ...ISO year. A single number designating the year. An ISO year value assigns positive values to CE years and negative values to BCE years, with 1 BCE being year 0.2014
QQuarter, using one digit2
QQQuarter, using two digits02
QQQQuarter, abbreviatedQ2
QQQQQuarter, full name2nd quarter
MMonth, numerical using one or two digits4
MMMonth, numerical using two digits04
MMMMonth, abbreviated nameApr
MMMMMonth, full nameApril
MMMMMMonth, capitalized first letterA
WWeek of the month1
dDay of the month, using one or two digits5
ddDay of the month using two digits05
DDay of the year, using one, two or three digits95
DDDay of the year using two digits95
DDDDay of the year using three digits095
eDay of the week, numerical using one or two digits.7, where Sunday is the first day of the week.
eeDay of the week, numerical using two digits07
eeeDay, abbreviated nameSat
eeeeDay, full nameSaturday
eeeeeDay, capitalized first letterS
aDay period (AM or PM)PM
hHour, 12-hour clock notation using one or two digits9
hhHour, 12-hour clock notation using two digits09
HHour, 24-hour clock notation using one or two digits21
HHHour, 24-hour clock notation using two digits21
mMinute, using one or two digits41
mmMinute, using two digits41
sSecond, using one or two digits6
ssSecond, using two digits06
S, SS, ..., SSSSSSSSSFractional second, using the number of digits specified by the number of instances of 'S' (up to 9 digits).'SSS' truncates 6.12345 seconds to 123.

Some tips and considerations:

  • If you read a two-digit year number and specify the format as y or yy, then the pivot year determines the century to which the year belongs.

  • Use one or more u characters instead of y characters to represent the year when working with year numbers near zero.

  • Datetime values later than 144683 years CE or before 140743 BCE display only the year numbers, regardless of the specified format value.

Time Zone Offset Formats

Use these identifiers to specify the display format of the time zone offset. A time zone offset is the amount of time that a specific date and time is offset from UTC. This is different from a time zone, which comprises rules that determine the offsets for specific times of the year. Include a time zone offset identifier when you want to ensure that the time components are displayed unambiguously.

Letter IdentifierDescriptionDisplay
zAbbreviated name of the time zone offset. If this value is not available, then the time zone offset uses the short UTC format, such as UTC-4.EDT
ZISO 8601 basic format with hours, minutes, and optional seconds fields.-0400
ZZZZLong UTC format.UTC-04:00
ZZZZZISO 8601 extended format with hours, minutes, and optional seconds fields. A time offset of zero is displayed as the ISO 8601 UTC indicator “Z”.-04:00
x or XISO 8601 basic format with hours field and optional minutes field. If you specify X, a time offset of zero is displayed as the ISO 8601 UTC indicator “Z”.-04
xx or XXISO 8601 basic format with hours and minutes fields. If you specify XX, a time offset of zero is displayed as the ISO 8601 UTC indicator “Z”.-0400
xxx or XXXISO 8601 extended format with hours and minutes fields. If you specify XXX, a time offset of zero is displayed as the ISO 8601 UTC indicator “Z”.-04:00
xxxx or XXXXISO 8601 basic format with hours, minutes, and optional seconds fields. If you specify XXXX, a time offset of zero is displayed as the ISO 8601 UTC indicator “Z”.-0400
xxxxx or XXXXXISO 8601 extended format with hours, minutes, and optional seconds fields. If you specify XXXXX, a time offset of zero is displayed as the ISO 8601 UTC indicator “Z”.-04:00

Since R2024a

Selection mode for the SecondaryLabelFormat property, specified as one of these values:

  • "auto" — MATLAB automatically selects a format for the secondary label based on plotted datetime values and the TickLabelFormat property.

  • "manual" — You specify the format by setting the SecondaryLabelFormat property.

Rotation of tick labels, specified as a scalar value in degrees. Positive values give counterclockwise rotation. Negative values give clockwise rotation.

Alternatively, you can rotate the tick labels using the xtickangle, ytickangle, and ztickangle functions.

Note

The TickLabelRotation property for the ruler and the associated XTickLabelRotation, YTickLabelRotation, or ZTickLabelRotation property for the parent axes always have the same value. Setting one also sets the other.

Example: ax.XAxis.TickLabelRotation = 45;

Example: ax.YAxis.TickLabelRotation = -45;

Selection mode for the TickLabelRotation property, specified as one of these values:

  • 'auto' — Automatically select the tick label rotation.

  • 'manual' — Use a tick label rotation that you specify. To specify the rotation, set the TickLabelRotation property.

Note

The TickLabelRotationMode property for the ruler and the corresponding mode property of the parent axes always have the same value. Setting one also sets the other.

Tick mark direction, specified as one of these values:

  • 'in' — Direct the tick marks inward from the axis lines. This is the default for 2-D views.

  • 'out' — Direct the tick marks outward from the axis lines. This is the default for 3-D views.

  • 'both' — Center the tick marks over the axis lines.

  • 'none' — Do not display any tick marks.

If you assign a value to this property, then MATLAB sets the TickDirectionMode property to 'manual'.

Note

Setting the TickDir property for the parent axes sets the TickDirection property for the ruler to the same value. However, setting the ruler property does not set the axes property. To prevent the axes property value from overriding the ruler property value, set the axes value first, and then set the ruler value.

Selection mode for the TickDirection property, specified as one of these values:

  • 'auto' — Automatically select the tick direction.

  • 'manual' — Use a tick direction that you specify. To specify the tick direction, set the TickDirection property.

Tick mark length, specified as a two-element vector of the form [2Dlength 3Dlength]. The first element is the tick mark length in 2-D views. The second element is the tick mark length in 3-D views. Specify the values in units normalized relative to the longest axes dimension.

Note

Setting the TickLength property for the parent axes sets the TickLength property for the ruler to the same value. However, setting the ruler property does not set the axes property. To prevent the axes property value from overriding the ruler property value, set the axes value first, and then set the ruler value.

Example: ax.YAxis.TickLength = [0.02 0.035];

Minor tick mark display, specified as 'on' or 'off', or as numeric or logical 1 (true) or 0 (false). A value of 'on' is equivalent to true, and 'off' is equivalent to false. Thus, you can use the value of this property as a logical value. The value is stored as an on/off logical value of type matlab.lang.OnOffSwitchState.

  • 'on' — Display minor tick marks between the major tick marks on the axis. This is the default value for an axis with a log scale. The space between the major tick marks determines the number of minor tick marks. If the MinorTickValues property is set to empty [], then no minor tick marks appear. Specify the tick mark locations by setting the MinorTickValues property.

  • 'off' — Do not display minor tick marks. This is the default value for an axis with a linear scale.

Note

The MinorTick property for the ruler and the associated XMinorTick, YMinorTick, or ZMinorTick property for the parent axes always have the same value. Setting one also sets the other.

Example: ax.XAxis.MinorTick = 'on';

Minor tick mark locations, specified as a vector of increasing datetime values.

If you assign values to this property, then MATLAB sets the MinorTickValuesMode property to 'manual'.

Selection mode for the MinorTickValues property, specified as one of these values:

  • 'auto' — Use automatically calculated minor tick values.

  • 'manual' — Use minor tick values that you specify. To specify the values, set the MinorTickValues property.

Font

expand all

Font name, specified as a system supported font name or 'FixedWidth'. The default font depends on the specific system and locale. To use a fixed-width font that renders well, specify 'FixedWidth'. The actual fixed-width font used depends on the FixedWidthFontName property of the root object.

Note

Setting the FontName property for the parent axes sets the FontName property for the ruler to the same value. However, setting the ruler property does not set the axes property. To prevent the axes property value from overriding the ruler property value, set the axes value first, and then set the ruler value.

Example: ax.XAxis.FontName = 'Cambria';

Font size, specified as a scalar numeric value. The default font size depends on the specific operating system and locale.

Note

  • Setting the FontSize property for the parent axes sets the FontSize property for the ruler to the same value. However, setting the ruler property does not set the axes property. To prevent the axes property value from overriding the ruler property value, set the axes value first, and then set the ruler value.

  • Setting the FontSize property on the ruler changes the size of the tick labels. MATLAB also updates the font size of the corresponding axes label using the LabelFontSizeMultiplier of the parent axes. For example, setting the font size of an x-axis ruler to 12 sets the font size for the XLabel property of the parent axes to 12 times the value of the LabelFontSizeMultiplier property.

Example: ax.XAxis.FontSize = 12;

Thickness of the text characters, specified as one of these values:

  • 'normal' — Default weight as defined by the particular font.

  • 'bold' — Thicker character outlines than normal.

MATLAB uses the FontWeight property to select a font from those available on your system. Not all fonts have a bold font weight. Therefore, specifying a bold font weight still can result in the normal font weight.

Note

Setting the FontWeight property for the parent axes sets the FontWeight property for the ruler to the same value. However, setting the ruler property does not set the axes property. To prevent the axes property value from overriding the ruler property value, set the axes value first, and then set the ruler value.

Example: ax.XAxis.FontWeight = 'bold';

Character slant, specified as 'normal' or 'italic'. Not all fonts have both font styles. Therefore, the italic font can look the same as the normal font.

Note

Setting the FontAngle property for the parent axes sets the FontAngle property for the ruler to the same value. However, setting the ruler property does not set the axes property. To prevent the axes property value from overriding the ruler property value, set the axes value first, and then set the ruler value.

Example: ax.XAxis.FontAngle = 'italic';

Text smoothing, specified as 'on' or 'off', or as numeric or logical 1 (true) or 0 (false). A value of 'on' is equivalent to true, and 'off' is equivalent to false. Thus, you can use the value of this property as a logical value. The value is stored as an on/off logical value of type matlab.lang.OnOffSwitchState.

  • 'on' — Enable text antialiasing to reduce the jagged appearance of text characters and make the text easier to read. In certain cases, smoothed text blends against the background color and can make the text appear blurry.

  • 'off' — Disable text antialiasing. Use this setting if the text seems blurry.

Note

  • Setting the FontSmoothing property for the parent axes sets the FontSmoothing property for the ruler to the same value. However, setting the ruler property does not set the axes property. To prevent the axes property value from overriding the ruler property value, set the axes value first, and then set the ruler value.

  • The FontSmoothing property will have no effect in a future release. Font smoothing will be enabled regardless of the value of the property.

Example: ax.XAxis.FontSmoothing = 'off';

Callbacks

expand all

Axis limits changed callback, specified as one of these values:

  • A function handle.

  • A cell array in which the first element is a function handle. Subsequent elements in the cell array are the arguments to pass to the callback function.

  • A character vector containing a valid MATLAB expression (not recommended). MATLAB evaluates this expression in the base workspace.

This callback executes after the axis limits have changed, either programmatically or using an interaction such as panning within the axes. It can also execute if MATLAB changes the axis limits to encompass the range of your data when you call a plotting function.

This callback function can access specific information about the axis limits. MATLAB passes this information in a LimitsChanged object as the second argument to your callback function. If you are developing an app in App Designer, the argument is called event. You can query the object properties using dot notation. For example, event.NewLimits returns the new axis limits. The LimitsChanged object is not available to callback functions specified as character vectors.

The following table lists the properties of the LimitsChanged object.

Property

Description

Source

Ruler object that executes the callback

EventName

'LimitsChanged'

OldLimits

Two-element vector containing the previous axis limits

NewLimits

Two-element vector containing the new axis limits

For more information about writing callbacks in apps, see Callbacks in App Designer.

Parent/Child

expand all

Ruler parent, specified as an Axes object.

Note

Ruler objects are not listed in the Children property of the parent Axes object.

The ruler has no children. You cannot set this property.

Version History

Introduced in R2016b

expand all

See Also

Functions

Properties