Main Content

binscatter

Binned scatter plot

Description

binscatter(x,y) displays a binned scatter plot for vectors x and y. A binned scatter plot partitions the data space into rectangular bins and displays the count of data points in each bin using different colors. When zooming into the plot, the bin sizes automatically adjust to show finer resolution.

example

binscatter(x,y,N) specifies the number of bins to use. N can be a scalar or a two-element vector [Nx Ny]. If N is a scalar, then Nx and Ny are both set to the scalar value. The maximum number of bins in each dimension is 250.

example

binscatter(___,Name,Value) specifies property values with one or more name-value pair arguments. For example, you can specify 'ShowEmptyBins' as 'on' to color areas with no data points. For a full list of properties, see Binscatter Properties. Use this option with any of the input argument combinations in previous syntaxes.

binscatter(ax,___) plots into the axes specified by ax instead of into the current axes (gca). The ax input can precede any of the input argument combinations in previous syntaxes.

h = binscatter(___) returns a Binscatter object. Use this object to inspect and adjust the properties of the binned scatter plot.

example

Examples

collapse all

Generate random numbers in both the x and y dimensions and create a binned scatter plot. The binscatter function automatically chooses an appropriate number of bins to cover the range of values in the data.

x = randn(1e6,1);
y = 2*x + randn(1e6,1);
binscatter(x,y)

Figure contains an axes object. The axes object contains an object of type binscatter.

Plot a binned scatter plot of 10,000 random numbers sorted into 30 bins in the x dimension and 10 bins in the y dimension.

rng default % for reproducibility
x = randn(1e4,1);
y = randn(1e4,1);
h = binscatter(x,y,[30 10]);

Figure contains an axes object. The axes object contains an object of type binscatter.

Find the bin counts. The result is a matrix with the top left element corresponding to the bin count of the bottom left bin in the plot. The x bins are in the rows of the matrix and the y bins are in the columns.

counts = h.Values;

Create a binned scatter plot of some random data points.

x = randn(1e5,1);
y = randn(1e5,1);
binscatter(x,y)

Figure contains an axes object. The axes object contains an object of type binscatter.

The default color map ranges from light colors (for small values) to dark colors (for large values). Switching to a color map that uses dark colors for small values can make it easier to spot outliers.

Use the colormap function to change the colors in the plot. Pass in the current axes handle using gca.

colormap(gca,'parula')

Figure contains an axes object. The axes object contains an object of type binscatter.

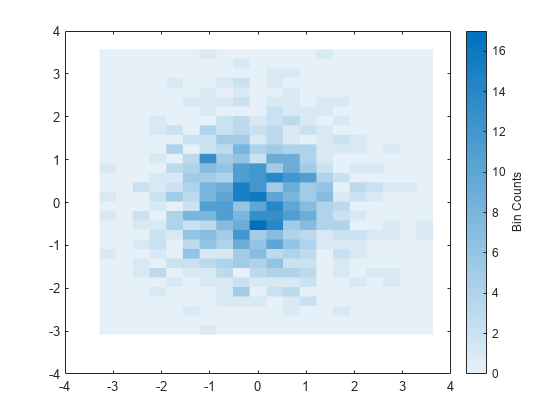
Generate 1,000 random numbers and create a binned scatter plot. Return the Binscatter object to adjust properties of the plot without recreating the entire plot.

x = randn(1000,1);
y = randn(1000,1);
h = binscatter(x,y)

Figure contains an axes object. The axes object contains an object of type binscatter.

h = 
  Binscatter with properties:

      NumBins: [11 11]
    XBinEdges: [-3.2764 -2.6485 -2.0206 -1.3927 -0.7648 -0.1369 0.4910 1.1189 1.7468 2.3747 3.0026 3.6305]
    YBinEdges: [-3.1155 -2.5034 -1.8914 -1.2794 -0.6674 -0.0553 0.5567 1.1687 1.7808 2.3928 3.0048 3.6168]
       Values: [11x11 double]
      XLimits: [-3.2764 3.6305]
      YLimits: [-3.1155 3.6168]
    FaceAlpha: 1

  Use GET to show all properties

Specify exactly how many bins to use in each direction.

h.NumBins = [20 30];

Figure contains an axes object. The axes object contains an object of type binscatter.

Turn on the display of empty bins in the plot.

h.ShowEmptyBins = 'on';

Figure contains an axes object. The axes object contains an object of type binscatter.

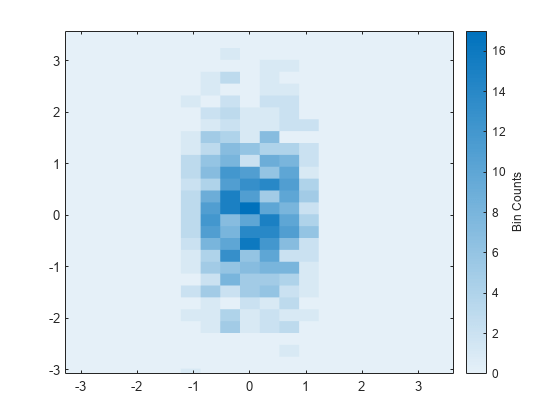
Specify the extent of the axes with the XLimits and YLimits properties. Then limit the bin limits in the x direction with a vector.

xlim(gca,h.XLimits); 
ylim(gca,h.YLimits); 
h.XLimits = [-1 1];

Figure contains an axes object. The axes object contains an object of type binscatter.

Input Arguments

collapse all

Input vectors, specified as real vectors of the same length.

Data Types: single | double | int8 | int16 | int32 | int64 | uint8 | uint16 | uint32 | uint64 | logical | datetime | duration

Number of bins, specified as a scalar or two-element vector [Nx Ny].

  • If N is a two-element vector [Nx Ny], then binscatter uses Nx bins in the x dimension and Ny bins in the y dimension.

  • If N is a scalar, then Nx and Ny are both set to the scalar value.

binscatter uses Nx and Ny bins along the x and y dimensions in the initial plot, when the axes are not zoomed in. (The axes are not zoomed in when the XLimMode and YLimMode properties are both 'auto'.) When zooming, binscatter adjusts the number of bins to maintain a bin size such that the visible portion of the plot is approximately divided into Nx-by-Ny bins.

The maximum number of bins in each dimension is 250. The default number of bins is computed based on the data size and standard deviation and does not exceed 100.

Example: [10 20]

Data Types: single | double | int8 | int16 | int32 | int64 | uint8 | uint16 | uint32 | uint64

Target axes, specified as an Axes object. If you do not specify the axes, then binscatter uses the current axes (gca).

Name-Value Arguments

Specify optional pairs of arguments as Name1=Value1,...,NameN=ValueN, where Name is the argument name and Value is the corresponding value. Name-value arguments must appear after other arguments, but the order of the pairs does not matter.

Before R2021a, use commas to separate each name and value, and enclose Name in quotes.

Example: binscatter(x,y,'ShowEmptyBins','on') turns on the display of empty bins in the plot.

The properties listed here are only a subset. For a complete list, see Binscatter Properties.

Data limits in x-dimension, specified as a two-element vector [Xmin Xmax].

binscatter only displays data points that fall within the specified data limits inclusively, XminXXmax.

Example: [0 10]

Data Types: single | double | int8 | int16 | int32 | int64 | uint8 | uint16 | uint32 | uint64 | datetime | duration

Data limits in y-dimension, specified as a two-element vector [Ymin Ymax].

binscatter only displays data points that fall within the specified data limits inclusively, YminYYmax.

Example: [0 10]

Data Types: single | double | int8 | int16 | int32 | int64 | uint8 | uint16 | uint32 | uint64 | datetime | duration

Toggle to show empty bins, specified as either 'off' or 'on', or as numeric or logical 1 (true) or 0 (false). A value of 'on' is equivalent to true, and 'off' is equivalent to false. Thus, you can use the value of this property as a logical value. The value is stored as an on/off logical value of type matlab.lang.OnOffSwitchState.

Specify 'on' or true to color tiles in the plot that fall within the bin limits, but have no data points.

Output Arguments

collapse all

Binscatter object. Use this object to inspect and adjust properties of the plot. For a full listing of properties, see Binscatter Properties.

Tips

  • Change the ColorScale property of the axes to 'log' to produce better bin coloring when a few bins dominate the plot.

    ax = gca;
    ax.ColorScale = 'log';

Extended Capabilities

Version History

Introduced in R2017b

Go to top of page