animatedline
Create animated line
Syntax
Description
an = animatedlineaddpoints function.
an = animatedline(___,Name,Value)'Color','r' sets the line color to red. Use this
option after any of the input argument combinations in the previous
syntaxes.
Examples
Create the initial animated line object. Then, use a loop to add 1,000 points to the line. After adding each new point, use drawnow to display the new point on the screen.
h = animatedline;
axis([0,4*pi,-1,1])

x = linspace(0,4*pi,1000);
y = sin(x);
for k = 1:length(x)
    addpoints(h,x(k),y(k));
    drawnow
end
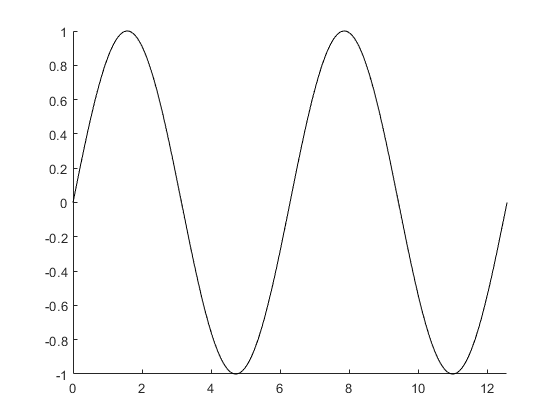
For faster rendering, add more than one point to the line each time through the loop or use drawnow limitrate.
Query the points of the line.
[xdata,ydata] = getpoints(h);
Clear the points from the line.
clearpoints(h)
drawnow
Set the color of the animated line to red and set its line width to 3 points.
x = [1 2];
y = [1 2];
h = animatedline(x,y,'Color','r','LineWidth',3);

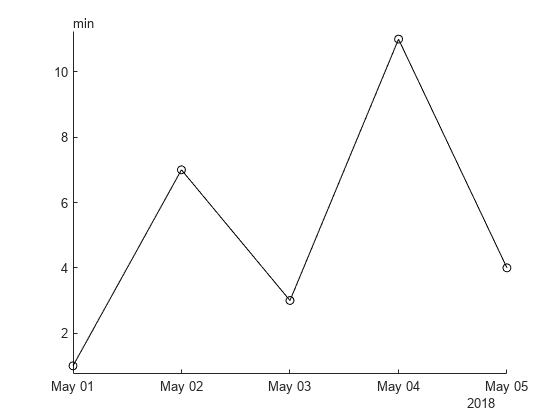
To plot nonnumeric points, such as datetime and duration values, start by initializing the animated line with values of the type you want to plot. You can specify either the first point in your plot or placeholder values such as NaT or NaN.
For example, plot datetime values on the x-axis and duration values (minutes) on the y-axis. Initialize the animated line with a NaT value and a minutes(NaN) value. Then create a datetime vector (x) and a duration vector (y) and add the points in those vectors to the animated line.
an = animatedline(NaT,minutes(NaN),"Marker","o");
x = datetime(2018,5,1:5);
y = minutes([1 7 3 11 4]);
addpoints(an,x,y)
Limit the number of points in the animated line to 100. Use a loop to add one point to the line at a time. When the line contains 100 points, adding a new point to the line deletes the oldest point.
h = animatedline('MaximumNumPoints',100);
axis([0,4*pi,-1,1])

x = linspace(0,4*pi,1000);
y = sin(x);
for k = 1:length(x)
    addpoints(h,x(k),y(k));
    drawnow
end

Use a loop to add 100,000 points to an animated line. Since the number of points is large, adding one point to the line each time through the loop might be slow. Instead, add 100 points to the line each time through the loop for a faster animation.
h = animatedline;
axis([0,4*pi,-1,1])

numpoints = 100000;
x = linspace(0,4*pi,numpoints);
y = sin(x);
for k = 1:100:numpoints-99
    xvec = x(k:k+99);
    yvec = y(k:k+99);
    addpoints(h,xvec,yvec)
    drawnow
end
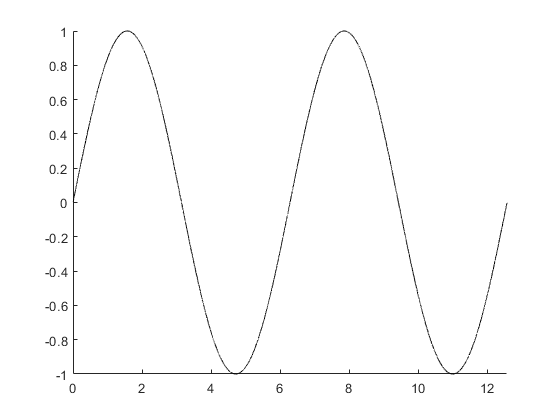
Another technique for creating faster animations is to use drawnow limitrate instead of drawnow.
Use a loop to add 100,000 points to an animated line. Since the number of points is large, using drawnow to display the changes might be slow. Instead, use drawnow limitrate for a faster animation.
h = animatedline;
axis([0,4*pi,-1,1])
drawnow

numpoints = 100000;
x = linspace(0,4*pi,numpoints);
y = sin(x);
for k = 1:numpoints
    addpoints(h,x(k),y(k))
    drawnow limitrate
end
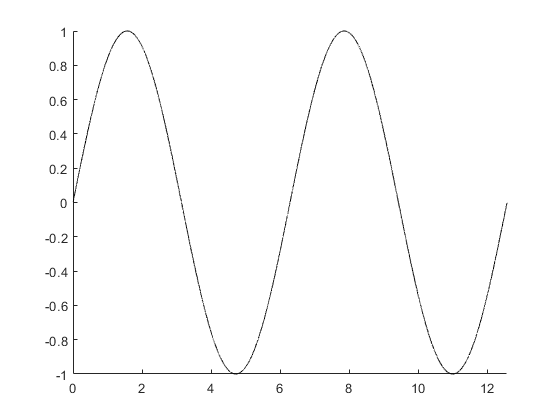
Run through several iterations of the animation loop before drawing the updates on the screen. Use this technique when drawnow is too slow and drawnow limitrate is too fast.
For example, update the screen every 1/30 seconds. Use the tic and toc commands to keep track of how much time passes between screen updates.
h = animatedline;
axis([0,4*pi,-1,1])
numpoints = 10000;
x = linspace(0,4*pi,numpoints);
y = sin(x);
a = tic; % start timer
for k = 1:numpoints
    addpoints(h,x(k),y(k))
    b = toc(a); % check timer
    if b > (1/30)
        drawnow % update screen every 1/30 seconds
        a = tic; % reset timer after updating
    end
end
drawnow % draw final frame

A smaller interval updates the screen more often and results in a slower animation. For example, use b > (1/1000) to slow down the animation.
Input Arguments
Starting x-coordinate, specified as a scalar or vector
the same size as y.
In polar coordinates, x corresponds to the starting
theta value. In geographic coordinates, x corresponds to
the starting latitude in degrees.
Data Types: single | double | int8 | int16 | int32 | int64 | uint8 | uint16 | uint32 | uint64 | datetime | duration
Starting y-coordinate, specified as a scalar or vector
the same size as x.
In polar coordinates, y corresponds to the starting
radius value. In geographic coordinates, y corresponds to
the starting longitude in degrees.
Data Types: single | double | int8 | int16 | int32 | int64 | uint8 | uint16 | uint32 | uint64 | datetime | duration
Starting z-coordinate, specified as a scalar or vector.
Data Types: single | double | int8 | int16 | int32 | int64 | uint8 | uint16 | uint32 | uint64 | datetime | duration
Target axes, specified as any type of axes, a Group object, or a Transform object. If you do not specify this argument, then
animatedline uses the current axes.
Name-Value Arguments
Specify optional pairs of arguments as
Name1=Value1,...,NameN=ValueN, where Name is
the argument name and Value is the corresponding value.
Name-value arguments must appear after other arguments, but the order of the
pairs does not matter.
Example: animatedline(x,y,Color="red",Marker="o") creates an
animated line with red circular markers.
Before R2021a: use commas to separate each name and value,
and enclose Name in quotes. for example,
animatedline(x,y,"Color","red","Marker","o") creates an
animated line with red circular markers.
The animated line properties listed here are only a subset. For a complete list, see AnimatedLine Properties.
Line color, specified as an RGB triplet, a hexadecimal color code, a color name, or a short name.
For a custom color, specify an RGB triplet or a hexadecimal color code.
An RGB triplet is a three-element row vector whose elements specify the intensities of the red, green, and blue components of the color. The intensities must be in the range
[0,1], for example,[0.4 0.6 0.7].A hexadecimal color code is a string scalar or character vector that starts with a hash symbol (
#) followed by three or six hexadecimal digits, which can range from0toF. The values are not case sensitive. Therefore, the color codes"#FF8800","#ff8800","#F80", and"#f80"are equivalent.
Alternatively, you can specify some common colors by name. This table lists the named color options, the equivalent RGB triplets, and the hexadecimal color codes.
| Color Name | Short Name | RGB Triplet | Hexadecimal Color Code | Appearance |
|---|---|---|---|---|
"red" | "r" | [1 0 0] | "#FF0000" |
|
"green" | "g" | [0 1 0] | "#00FF00" |
|
"blue" | "b" | [0 0 1] | "#0000FF" |
|
"cyan"
| "c" | [0 1 1] | "#00FFFF" |
|
"magenta" | "m" | [1 0 1] | "#FF00FF" |
|
"yellow" | "y" | [1 1 0] | "#FFFF00" |
|
"black" | "k" | [0 0 0] | "#000000" |
|
"white" | "w" | [1 1 1] | "#FFFFFF" |
|
"none" | Not applicable | Not applicable | Not applicable | No color |
This table lists the default color palettes for plots in the light and dark themes.
| Palette | Palette Colors |
|---|---|
Before R2025a: Most plots use these colors by default. |
|
|
|
You can get the RGB triplets and hexadecimal color codes for these palettes using the orderedcolors and rgb2hex functions. For example, get the RGB triplets for the "gem" palette and convert them to hexadecimal color codes.
RGB = orderedcolors("gem");
H = rgb2hex(RGB);
Before R2023b: Get the RGB triplets using RGB =
get(groot,"FactoryAxesColorOrder").
Before R2024a: Get the hexadecimal color codes using H =
compose("#%02X%02X%02X",round(RGB*255)).
Line style, specified as one of the options listed in this table.
| Line Style | Description | Resulting Line |
|---|---|---|
"-" | Solid line |
|
"--" | Dashed line |
|
":" | Dotted line |
|
"-." | Dash-dotted line |
|
"none" | No line | No line |
Line width, specified as a positive value in points, where 1 point = 1/72 of an inch. If the line has markers, then the line width also affects the marker edges.
The line width cannot be thinner than the width of a pixel. If you set the line width to a value that is less than the width of a pixel on your system, the line displays as one pixel wide.
Marker symbol, specified as one of the values listed in this table. By default, the object does not display markers. Specifying a marker symbol adds markers at each data point or vertex.
| Marker | Description | Resulting Marker |
|---|---|---|
"o" | Circle |
|
"+" | Plus sign |
|
"*" | Asterisk |
|
"." | Point |
|
"x" | Cross |
|
"_" | Horizontal line |
|
"|" | Vertical line |
|
"square" | Square |
|
"diamond" | Diamond |
|
"^" | Upward-pointing triangle |
|
"v" | Downward-pointing triangle |
|
">" | Right-pointing triangle |
|
"<" | Left-pointing triangle |
|
"pentagram" | Pentagram |
|
"hexagram" | Hexagram |
|
"none" | No markers | Not applicable |
Marker size, specified as a positive value in points, where 1 point = 1/72 of an inch.
Marker outline color, specified as "auto", an RGB triplet, a
hexadecimal color code, a color name, or a short name. The default value of
"auto" uses the same color as the Color
property.
For a custom color, specify an RGB triplet or a hexadecimal color code.
An RGB triplet is a three-element row vector whose elements specify the intensities of the red, green, and blue components of the color. The intensities must be in the range
[0,1], for example,[0.4 0.6 0.7].A hexadecimal color code is a string scalar or character vector that starts with a hash symbol (
#) followed by three or six hexadecimal digits, which can range from0toF. The values are not case sensitive. Therefore, the color codes"#FF8800","#ff8800","#F80", and"#f80"are equivalent.
Alternatively, you can specify some common colors by name. This table lists the named color options, the equivalent RGB triplets, and the hexadecimal color codes.
| Color Name | Short Name | RGB Triplet | Hexadecimal Color Code | Appearance |
|---|---|---|---|---|
"red" | "r" | [1 0 0] | "#FF0000" |
|
"green" | "g" | [0 1 0] | "#00FF00" |
|
"blue" | "b" | [0 0 1] | "#0000FF" |
|
"cyan"
| "c" | [0 1 1] | "#00FFFF" |
|
"magenta" | "m" | [1 0 1] | "#FF00FF" |
|
"yellow" | "y" | [1 1 0] | "#FFFF00" |
|
"black" | "k" | [0 0 0] | "#000000" |
|
"white" | "w" | [1 1 1] | "#FFFFFF" |
|
"none" | Not applicable | Not applicable | Not applicable | No color |
This table lists the default color palettes for plots in the light and dark themes.
| Palette | Palette Colors |
|---|---|
Before R2025a: Most plots use these colors by default. |
|
|
|
You can get the RGB triplets and hexadecimal color codes for these palettes using the orderedcolors and rgb2hex functions. For example, get the RGB triplets for the "gem" palette and convert them to hexadecimal color codes.
RGB = orderedcolors("gem");
H = rgb2hex(RGB);
Before R2023b: Get the RGB triplets using RGB =
get(groot,"FactoryAxesColorOrder").
Before R2024a: Get the hexadecimal color codes using H =
compose("#%02X%02X%02X",round(RGB*255)).
Marker fill color, specified as "auto", an RGB triplet, a hexadecimal
color code, a color name, or a short name. The "auto" option uses the
same color as the Color property of the parent axes. If you specify
"auto" and the axes plot box is invisible, the marker fill color is
the color of the figure.
For a custom color, specify an RGB triplet or a hexadecimal color code.
An RGB triplet is a three-element row vector whose elements specify the intensities of the red, green, and blue components of the color. The intensities must be in the range
[0,1], for example,[0.4 0.6 0.7].A hexadecimal color code is a string scalar or character vector that starts with a hash symbol (
#) followed by three or six hexadecimal digits, which can range from0toF. The values are not case sensitive. Therefore, the color codes"#FF8800","#ff8800","#F80", and"#f80"are equivalent.
Alternatively, you can specify some common colors by name. This table lists the named color options, the equivalent RGB triplets, and the hexadecimal color codes.
| Color Name | Short Name | RGB Triplet | Hexadecimal Color Code | Appearance |
|---|---|---|---|---|
"red" | "r" | [1 0 0] | "#FF0000" |
|
"green" | "g" | [0 1 0] | "#00FF00" |
|
"blue" | "b" | [0 0 1] | "#0000FF" |
|
"cyan"
| "c" | [0 1 1] | "#00FFFF" |
|
"magenta" | "m" | [1 0 1] | "#FF00FF" |
|
"yellow" | "y" | [1 1 0] | "#FFFF00" |
|
"black" | "k" | [0 0 0] | "#000000" |
|
"white" | "w" | [1 1 1] | "#FFFFFF" |
|
"none" | Not applicable | Not applicable | Not applicable | No color |
This table lists the default color palettes for plots in the light and dark themes.
| Palette | Palette Colors |
|---|---|
Before R2025a: Most plots use these colors by default. |
|
|
|
You can get the RGB triplets and hexadecimal color codes for these palettes using the orderedcolors and rgb2hex functions. For example, get the RGB triplets for the "gem" palette and convert them to hexadecimal color codes.
RGB = orderedcolors("gem");
H = rgb2hex(RGB);
Before R2023b: Get the RGB triplets using RGB =
get(groot,"FactoryAxesColorOrder").
Before R2024a: Get the hexadecimal color codes using H =
compose("#%02X%02X%02X",round(RGB*255)).
Maximum number of points stored and displayed as part of the
line, specified as a positive value or Inf. By
default, the value is one million points. If the number of points
exceeds the maximum value permitted, then the animated line keeps
the most recently added points and drops points from the beginning
of the line. These dropped points no longer display on the screen
and are not returned when using getpoints.
Use this property to limit the number of points appearing on
the screen at any given time or to limit the amount of memory used.
If you specify the value as Inf, then the animated
line does not drop any points, but the number of points stored is
limited by the amount of memory available.
Example: 10
Data Types: single | double | int8 | int16 | int32 | int64 | uint8 | uint16 | uint32 | uint64
Output Arguments
AnimatedLine object. Use
an to modify the AnimatedLine object after its been created, such as changing
property values or adding points to the line. For a list of properties, see
AnimatedLine Properties.
Limitations
Animated lines do not support data tips.
Extended Capabilities
The animatedline function
supports GPU array input with these usage notes and limitations:
This function accepts GPU arrays, but does not run on a GPU.
For more information, see Run MATLAB Functions on a GPU (Parallel Computing Toolbox).
Usage notes and limitations:
This function operates on distributed arrays, but executes in the client MATLAB®.
For more information, see Run MATLAB Functions with Distributed Arrays (Parallel Computing Toolbox).
Version History
Introduced in R2014bCreate animated lines using single, double, integer, datetime, or duration data for the x-, y-, and z-coordinates.
MATLAB Command
You clicked a link that corresponds to this MATLAB command:
Run the command by entering it in the MATLAB Command Window. Web browsers do not support MATLAB commands.
Select a Web Site
Choose a web site to get translated content where available and see local events and offers. Based on your location, we recommend that you select: .
You can also select a web site from the following list
How to Get Best Site Performance
Select the China site (in Chinese or English) for best site performance. Other MathWorks country sites are not optimized for visits from your location.
Americas
- América Latina (Español)
- Canada (English)
- United States (English)
Europe
- Belgium (English)
- Denmark (English)
- Deutschland (Deutsch)
- España (Español)
- Finland (English)
- France (Français)
- Ireland (English)
- Italia (Italiano)
- Luxembourg (English)
- Netherlands (English)
- Norway (English)
- Österreich (Deutsch)
- Portugal (English)
- Sweden (English)
- Switzerland
- United Kingdom (English)