Contour Plot with Major and Minor Grid Lines
You can create a contour plot with emphasis on selected contour lines by splitting the data and creating two overlapping contour plots.
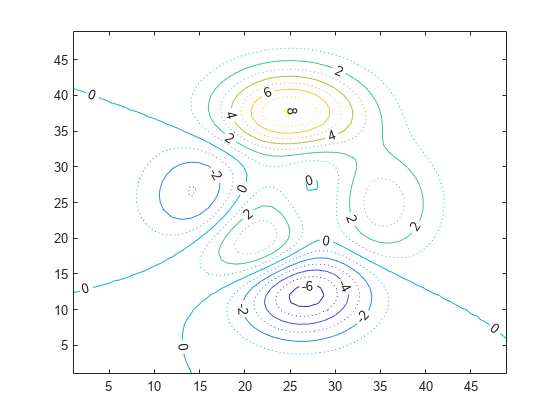
For example, create a contour plot of the peaks function where the even numbered contours lines are solid and the odd numbered contour lines are dotted. Plot one contour for the even numbered levels. Then, overlay a second contour plot with the odd numbered levels drawn with a dotted line.
major = -6:2:8;
minor = -5:2:7;
[cmajor,hmajor] = contour(peaks,'LevelList',major);
clabel(cmajor,hmajor)

hold on
[cminor,hminor] = contour(peaks,'LevelList',minor);
hminor.LineStyle = ':';
hold off