Create Maps Using Icons
Icon charts enable you to display symbols on maps. Create icon charts in geographic
axes or map axes by using the geoiconchart function. By default,
the function uses a pushpin icon. You can also use custom icons by specifying the name
of an image file.
This topic shows several ways to display icons on maps. For example, you can use icons to:
Represent point data.
Display quantitative data at representative points.
Animate movement along a path.
Annotate a basemap.
Represent Point Data
Use icons to represent the latitude and longitude coordinates of point data.
Read a shapefile containing tsunami events into the workspace as a geospatial table. The table represents the tsunami events using point shapes in geographic coordinates.
tsunamis = readgeotable("tsunamis.shp",CoordinateSystemType="geographic");
Create a subtable of tsunami events that were caused by volcanoes or by volcanoes and landslides.
idx = contains(tsunamis.Cause,"Volcano");
volcanos = tsunamis(idx,:);
Extract the latitude and longitude coordinates from the subtable. Then, display a volcano icon at each point by using the geoiconchart function. Return the IconChart object in ic.
lat = volcanos.Shape.Latitude;
lon = volcanos.Shape.Longitude;
ic = geoiconchart(lat,lon,"volcano.png");
Zoom out by changing the geographic limits of the map. Add a title.
geolimits([-68 81],[-180 180])
title("Tsunami Events Caused by Volcanoes")![]()
Display Quantitative Data at Representative Points
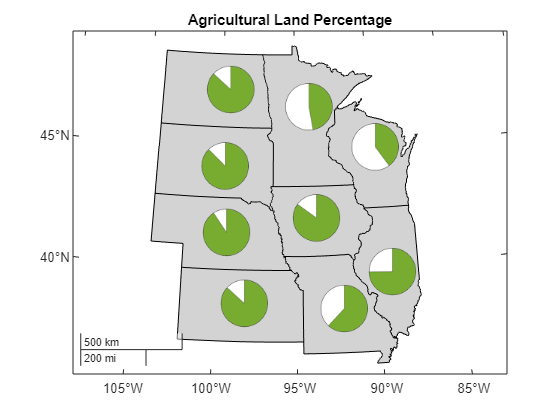
Use icons to display quantitative data at representative points. For this example, use pie chart icons to display the agricultural land percentage for several US states.
Import a shapefile of US states into the workspace as a geospatial table. Each table row includes the name of a state, a polygon shape for the state, and the latitude and longitude coordinates of a representative point in the state.
states = readgeotable("usastatehi.shp");Create a subtable of nine midwest states: Kansas, Nebraska, South Dakota, North Dakota, Iowa, Missouri, Minnesota, Wisconsin, and Illinois.
names = ["Kansas","Nebraska","South Dakota","North Dakota","Iowa","Missouri", ...
    "Minnesota","Wisconsin","Illinois"];
midwest = geocode(names,states);
Create a map by displaying the states in a map axes. Specify the projected coordinate reference system (CRS) for the map using the ESRI code 102008, which uses an Albers Equal Area projection.
figure
pcrs = projcrs(102008,Authority="ESRI");
newmap(pcrs)
geoplot(midwest,FaceColor=[0.5 0.5 0.5])
Display the agricultural land percentage for each state by using pie chart icons. The pie charts icons were created using data from the National Agricultural Statistics Service (NASS) Farms and Land in Farms 2019 Summary [1]. For each state:
Get the latitude and longitude coordinates of a point in the state.
Specify the name of the pie chart icon for the state. The icons are contained in the folder
"state-farm-icons", and are included with the example as supporting files. The icon files follow the naming convention"statename.png", wherestatenameis the name of a state. Where applicable, the names of the icon files use hyphens instead of spaces.Display the icon at the latitude and longitude coordinates. The green slice of the pie chart represents the agricultural land percentage.
hold on
for i = 1:height(midwest)
    % get latitude and longitude coordinates
    lat = midwest.LabelLat(i);
    lon = midwest.LabelLon(i);

    % specify name of file
    filename = replace(midwest.Name(i)," ","-") + ".png";
    filepath = fullfile("state-farm-icons",filename);

    % create icon chart
    geoiconchart(lat,lon,filepath,SizeData=60);
end
Customize the appearance of the map by adding a title and removing the graticule.
title("Agricultural Land Percentage")

mx = gca;
mx.GraticuleLineStyle = "none";

[1] National Agricultural Statistics Service. “Number of Farms, Land in Farms, and Average Farm Size — States and United States: 2018–2019.” In Farms and Land in Farms 2019 Summary, 6. USDA, February 2020. https://www.nass.usda.gov/Publications/Todays_Reports/reports/fnlo0220.pdf.
Animate Movement Along Path
Use an icon to represent movement along a path. Animate the icon by incrementally updating its latitude and longitude coordinates.
Read the path of a UAV into a geospatial table. The geospatial table represents the path using point shapes in geographic coordinates. Extract the latitude and longitude coordinates from the table.
GT = readgeotable("sample_uavtrack.gpx",Layer="track_points");
lat = GT.Shape.Latitude;
lon = GT.Shape.Longitude;
Display the path using a line over a topographic basemap. Prepare to add more data to the map by setting the hold state to on.
figure
geobasemap topographic
geoplot(lat,lon)
hold on
Create an icon chart at the start of the path. Specify the latitude and longitude coordinates using the first elements of the latitude and longitude vectors. Prepare to update the coordinates of the icon by returning the IconChart object in ic.
lat1 = lat(1);
lon1 = lon(1);
ic = geoiconchart(lat1,lon1,"uav.png");
Animate the icon. For each additional point in the path:
Specify new coordinates for the icon by changing the
LatitudeDataandLongitudeDataproperties.Calculate a rotation angle for the icon by using the
azimuthfunction. Theazimuthfunction calculates angles that are measured clockwise from north.Specify a new rotation angle for the icon by setting the
IconRotationproperty. TheIconRotationproperty rotates the angle in a counterclockwise-positive direction, so use the negative of the value returned by theazimuthfunction.View updates to the animation.
gx = gca;
for i = 2:length(lat)-1
    % specify new coordinates
    ic.LatitudeData = lat(i);
    ic.LongitudeData = lon(i);

    % calculate rotation angle
    r = azimuth(lat(i-1),lon(i-1),lat(i),lon(i));

    % specify new rotation angle
    ic.IconRotation = -r;

    % view updates
    drawnow
end
![]()
Annotate Basemap
Use icons to add supplemental information to a basemap. For this example, use icons to label an interstate on a satellite basemap.
Read road data into the workspace as a geospatial table. The table represents the roads using line shapes in geographic coordinates.
roads = readgeotable("boston_roads.shp");Create a subtable that contains the line shapes for Interstate 90 (I-90), which is also known as the Massachusetts Turnpike.
interstate = geocode("MASSACHUSETTS TURNPIKE",roads,"STREETNAME");
Display the line shapes for I-90 over satellite imagery.
figure
geobasemap satellite
hold on
geoplot(interstate,LineWidth=2,Color="#A2142F")
Label I-90 by adding two interstate icons. Prevent the icon from capturing mouse clicks, including clicks that add data tips, by setting the PickableParts property to "none".
geoiconchart([42.3480 42.3477],[-71.0959 -71.0508],"i-90.png",SizeData=30, ...
    PickableParts="none")
![]()
For an example that uses OpenStreetMap® data to create a base layer with icons, see Create Base Layer from OpenStreetMap Data.