Time Difference of Arrival Positioning Using PRS
This example shows how to use the Time Difference Of Arrival (TDOA) positioning approach in conjunction with the Release 9 Positioning Reference Signal (PRS) to calculate the position of a User Equipment (UE) within a network of eNodeBs using the LTE Toolbox™.
Introduction
In this example, a number of eNodeB transmissions are created and combined with different delays and received powers to model the reception of all the eNodeB waveforms by one UE. The UE performs correlation with the Positioning Reference Signal (PRS) to establish the delay from each eNodeB and subsequently the delay difference between all pairs of eNodeBs. These delay differences are used to compute hyperbolas of constant delay difference, which are plotted relative to known eNodeB positions and intersect at the position of the UE.
Transmitter Configuration
A set (cell array) of eNodeB configurations enb is created, with the number of eNodeBs specified by NeNodeB. The configurations are derived from Reference Measurement Channel (RMC) R.5 using lteRMCDL. R.5 describes a 3 MHz bandwidth Downlink Shared Channel (PDSCH) transmission using 64-QAM modulation. For each eNodeB the configuration is updated to make the cell identity NCellID unique and the PRS parameters NPRSRB, IPRS and PRSPeriod are set.
A random position given by an X and Y coordinate for each eNodeB is generated by the hPositioningPosition function.
rng('default'); % Initialize the random number generator stream
NeNodeB = 5;    % Number of eNodeB

% Create eNodeB configurations
enb = cell(1,NeNodeB);
for i=1:NeNodeB
   enb{i}=lteRMCDL('R.5');            % Get configuration based on RMC
   enb{i}.NCellID = mod((i-1)*2,504); % Set arbitrary cell identity
   enb{i}.TotSubframes = 1;           % Number of subframes to generate
   enb{i}.NPRSRB = 2;                 % Bandwidth of PRS in resource blocks
   enb{i}.IPRS = 0;                   % PRS configuration index
   enb{i}.PRSPeriod = 'On';           % PRS present in all subframes
   enb{i}.Position = hPositioningPosition(i-1, NeNodeB); % eNodeB position
end

% Use the first eNodeB configuration for general settings
info = lteOFDMInfo(enb{1});
Plot Location of eNodeBs and UE
The positions of the eNodeBs and the UE are plotted for reference. The UE lies at (0,0) and the eNodeBs are distributed around the UE.
hPositioningPlotPositions(enb);

Generate Transmissions
For each eNodeB, a transmission is made consisting of the PRS, Primary Synchronization Signal (PSS), Secondary Synchronization Signal (SSS) and Cell-specific Reference Signal (Cell RS). An empty resource grid is created and a PRS is generated and mapped onto the grid using ltePRS and ltePRSIndices. The PSS, SSS and Cell RS are added in a similar fashion. The resultant grid is OFDM modulated to produce a transmit waveform.
tx = cell(1,NeNodeB);
for i = 1:NeNodeB
    grid = [];
    for nsf = 0:19
        enb{i}.NSubframe = mod(nsf,10);
        sfgrid = lteDLResourceGrid(enb{i});       % Empty subframe
        sfgrid(ltePRSIndices(enb{i})) = ltePRS(enb{i});       % PRS REs
        sfgrid(ltePSSIndices(enb{i})) = ltePSS(enb{i});       % PSS REs
        sfgrid(lteSSSIndices(enb{i})) = lteSSS(enb{i});       % SSS REs
        sfgrid(lteCellRSIndices(enb{i})) = lteCellRS(enb{i}); % Cell RS REs
        grid = [grid sfgrid]; %#ok<AGROW>
    end
    enb{i}.NSubframe = 0;
    tx{i} = lteOFDMModulate(enb{i}, grid);        % OFDM modulate
end
Compute Delays from eNodeBs to UEs
Using the known eNodeB positions, the time delay from each eNodeB to the UE is calculated using the distance between the UE and eNodeB, radius, and the speed of propagation (speed of light). Using knowledge of the sampling rate, info.SamplingRate, the sample delay is calculated and stored in sampleDelay. These variables will be used to model the environment between the eNodeBs and the UE but the information will NOT be provided to the UE.
speedOfLight = 299792458.0; % Speed of light in m/s

sampleDelay = zeros(1, NeNodeB);
radius = cell(1, NeNodeB);
for i = 1:NeNodeB
   [~, radius{i}] = cart2pol(enb{i}.Position(1), enb{i}.Position(2));
   delay = radius{i}/speedOfLight;                  % Delay in seconds
   sampleDelay(i) = round(delay*info.SamplingRate); % Delay in samples
end
Create Sum of Received Waveforms and Plot Received Waveforms
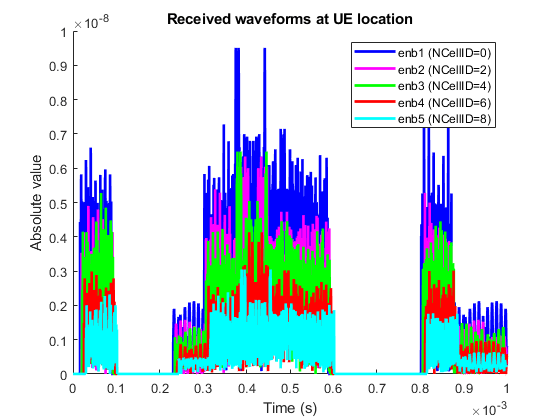
The received signal at the UE is modeled by delaying each eNodeB transmission according to the values in sampleDelay, and attenuating the received signal from each eNodeB using the values in radius in conjunction with an implementation of the TR 36.814 [ 1 ] Urban Macro Line Of Sight (LOS) path loss model. The received waveform from each eNodeB is padded with zeros to ensure all waveforms are the same length.
sumrx = zeros(length(tx{1})+max(sampleDelay), 1);
rx = cell(1, NeNodeB);
for i = 1:NeNodeB
    % Urban Macro LOS path loss per TR36.814
    PLdB = hPositioningPathLoss(radius{i}, 2.1e9);
    PL = 10^(PLdB/10);

    % Add delay, pad and attenuate
    rx{i} = [zeros(sampleDelay(i), 1); tx{i}; ...
                zeros(max(sampleDelay)-sampleDelay(i), 1)]/ sqrt(PL);

    % Sum waveforms from all eNodeBs
    sumrx = sumrx + rx{i};
end

% Plot received waveforms
hPositioningPlotRx(enb, rx, info.SamplingRate);

Perform Cell Search to Establish Cell Identities
Multi-cell search is performed in order to identify the cell identity of each eNodeB. An array of configurations rxcfg for the eNodeBs is then created based on the detected cell identities and assuming that the PRS configuration has been given by higher-layer signaling and is therefore known to the UE. A number of other physical layer parameters such as the cyclic prefix length and duplex mode are assumed to be known and are assumed to be equal for each eNodeB. See the Cell Search, MIB and SIB1 Recovery example for more information on detecting these parameters.
% Assumed parameters for cell search
searchcfg.CyclicPrefix = enb{1}.CyclicPrefix;
searchcfg.DuplexMode = enb{1}.DuplexMode;
searchcfg.NDLRB = enb{1}.NDLRB;

% Perform multi-cell search
searchalg.MaxCellCount = NeNodeB;
searchalg.SSSDetection = 'PostFFT';
[cellIDs,offsets] = lteCellSearch(searchcfg,sumrx,searchalg);

% Set up configurations for each detected cell; cells are considered as
% detected here if they meet a minimum RSRQ threshold Qqualmin
Qqualmin = -20;
RSRQdB = zeros(1,searchalg.MaxCellCount);
rxcfg = cell(1,searchalg.MaxCellCount);
for i = 1:searchalg.MaxCellCount
    % Assumed parameters
    rxcfg{i} = enb{1};
    % Use cell identity that was detected
    rxcfg{i}.NCellID = cellIDs(i);
    % Measure RSRQ
    rxgrid = lteOFDMDemodulate(rxcfg{i},sumrx(1+offsets(i):end,:));
    meas = hRSMeasurements(rxcfg{i},rxgrid);
    RSRQdB(i) = meas.RSRQdB;
end
rxcfg(RSRQdB<Qqualmin) = [];
Ndetected = numel(rxcfg);
Estimate Arrival Times
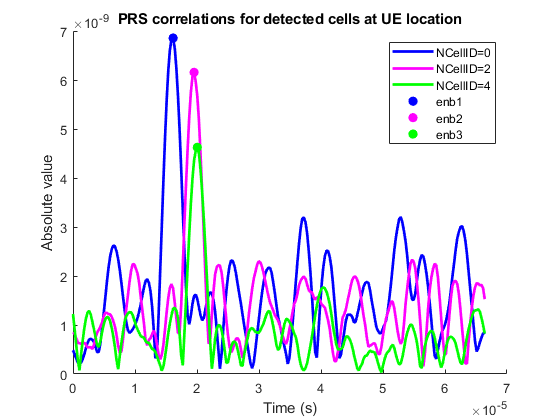
The arrival times of the signals from each eNodeB are established at the UE by correlating the incoming signal with a local PRS generated with the cell identity of each eNodeB. Note that the absolute arrival times cannot be used at the UE to calculate its position as it has no knowledge of how far away the eNodeBs are, only the difference in distances given by the difference in arrival times. Therefore, the peak correlation for each eNodeB is used as a delay estimate to allow comparison.
ref = cell(1, Ndetected);
corr = cell(1, Ndetected);
delayEst = zeros(1, Ndetected);
for i = 1:Ndetected
    % Generate reference PRS
    sfgrid = lteDLResourceGrid(rxcfg{i});
    sfgrid(ltePRSIndices(rxcfg{i})) = ltePRS(rxcfg{i});
    ref{i} = lteOFDMModulate(rxcfg{i},sfgrid);

    % Correlate received signal with each reference PRS
    c = abs(xcorr(sumrx,ref{i}));

    % Reduced length of correlation vector for positioning and plotting
    c(1:length(sumrx)) = [];    % Remove meaningless result at beginning
    corr{i} = c(1:info.Nfft);   % Extract an OFDM symbol's worth of data

    % Delay estimate is at point of maximum correlation
    delayEst(i) = find(corr{i}==max(corr{i}));
end

% Plot correlation
if (Ndetected>0)
    hPositioningPlotCorr(rxcfg, corr, info.SamplingRate);
end

Compute TDOA and Plot Constant TDOA Hyperbolas
Using the arrival times, the time differences of arrival between each pair of eNodeBs is calculated using the hPositioningTDOA function. The particular time difference of arrival between a pair of eNodeBs can result from the UE being located at any position where two circles, each centered on an eNodeB, intersect. The two circles have radii which differ by the distance covered at the speed of light in the given time difference. The complete set of possible UE positions across all possible radii for one circle (with the other circle maintaining a radius appropriate to the time difference as already described) forms a hyperbola. The "hyperbolas of constant delay difference" for all the different pairs of eNodeBs are plotted relative to the known eNodeB positions and intersect at the position of the UE.
% Estimate time difference of arrival from each eNodeB
tdoa = hPositioningTDOA(delayEst,info.SamplingRate);

% Plot hyperbolas
figure(1);
legendstr = feval(@(x)x.String,legend);
enbs = [enb{:}];
txCellIDs = [enbs.NCellID];
for j = 1:Ndetected
    for i = (j+1):Ndetected
        dd = tdoa(i,j)*speedOfLight; % Delay distance
        % establish the eNodeBs for which the delay distance
        % is applicable by examining the detected cell identities
        txi = find(txCellIDs==rxcfg{i}.NCellID);
        txj = find(txCellIDs==rxcfg{j}.NCellID);
        if (~isempty(txi) && ~isempty(txj))
            % plot TDOA curve
            [x, y] = hPositioningTDOACurve(enb{txi}.Position, ...
                enb{txj}.Position, dd);
            plot(x, y, 'k:', 'LineWidth', 2);
        end
    end
end
legend(legendstr);

Appendix
This example uses these helper functions.
References
3GPP TR 36.814 "Further advancements for E-UTRA physical layer aspects"