Main Content

gpuprofile

Profile execution time for generated CUDA code

Since R2024a

Description

gpuprofile action profiles the execution times for the generated CUDA® code and displays the profiling results in the GPU Performance Analyzer report. Use this information to visualize code metrics and identify optimization and tuning opportunities in your generated GPU code. See GPU Performance Analyzer.

s = gpuprofile("status") returns a structure that contains the GPU profiler status information. This structure contains a single field Running, which is a logical value that indicates whether the GPU profiler is currently running.

example

Examples

collapse all

This example shows how to use the codegen and gpuprofile commands to generate and profile an instrumented CUDA MEX function. For more information on the MATLAB® code that this example uses, see Fog Rectification.

This example uses the design file fog_rectification.m and the image file foggyInput.png. To create a folder that contains these files, run this command.

openExample('gpucoder/FogRectificationGPUExample')

Generate a CUDA MEX for the fog_rectification function by running the codegen command with the -gpuprofile option. This option adds profiling instrumentation to the generated MEX.

cfg = coder.gpuConfig('mex');
inputImg = imread('foggyInput.png');
codegen -config cfg -args {inputImg} fog_rectification.m -gpuprofile

Start the GPU profiler, Run the generated MEX twice and view the profiling results.

gpuprofile on
fog_rectification_mex(inputImg);
gpuprofile viewer

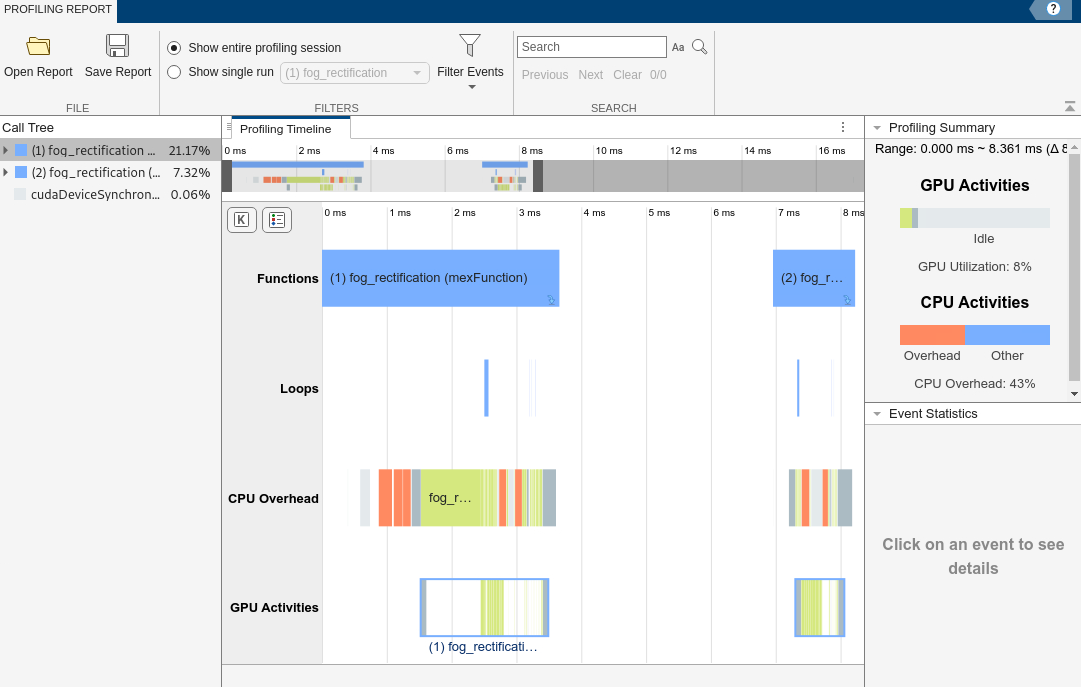
The GPU Performance Analyzer report shows CPU overhead and GPU activities for the two MEX executions. The report also shows the Functions and Loops events.

The GPU Performance Analyzer window showing two MEX function events for fog_rectification. The first MEX function had more time spent on CPU overhead than the second MEX function event.

Input Arguments

collapse all

Control options for the GPU profiler, specified as one of these options.

OptionResult
on

Start the GPU profiler, clearing any previously recorded profile statistics.

off

Stop the GPU profiler.

clear

Stop the GPU profiler and clear the recorded statistics.

viewerStop the GPU profiler and display a Performance Analyzer report of the collected profiling data.
statusReturn a structure that contains the GPU profiler status information. This structure contains a single field Running, which is a logical value that indicates whether the GPU profiler is currently running.

Version History

Introduced in R2024a