ctrectmeas
Measurement function of constant turn-rate motion model for rectangular targets
Description
returns the expected measurements from the current rectangular states and detections for an
extended target based on the constant turn-rate motion model. The measurements
= ctrectmeas(states
,detections
)gmphd
object can use ctrectmeas
as its
MeasurementFcn
.
Examples
Expected Detections Using Rectangular Measurement Model
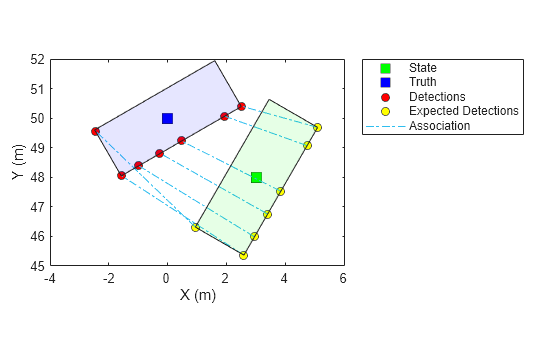
Load detections and truth generated from a rectangular target.
load('rectangularTargetDetections.mat','detections','truthState');
Generate expected detections from the target's rectangular state and actual detections using ctrectmeas
.
tgtState = [3;48;0;60;0;5;1.9]; zExp = ctrectmeas(tgtState,detections);
Set up visualization environment using theaterPlot
.
theaterP = theaterPlot; stateP = trackPlotter(theaterP,'DisplayName','State','MarkerFaceColor','g'); truthP = trackPlotter(theaterP,'DisplayName','Truth','MarkerFaceColor', 'b'); detP = detectionPlotter(theaterP,'DisplayName','Detections','MarkerFaceColor','r'); expDetP = detectionPlotter(theaterP,'DisplayName','Expected Detections','MarkerFaceColor','y'); l = legend(theaterP.Parent); l.AutoUpdate = 'on'; hold on; assignP = plot(theaterP.Parent,NaN,NaN,'-.','DisplayName','Association');
Plot actual and expected detections.
inDets = [detections{:}]; inMeas = horzcat(inDets.Measurement); detP.plotDetection(inMeas'); zExpPlot = reshape(zExp,3,[]); expDetP.plotDetection(zExpPlot');
Plot association lines.
zLines = nan(2,numel(detections)*3); zLines(1,1:3:end) = zExpPlot(1,:); zLines(2,1:3:end) = zExpPlot(2,:); zLines(1,2:3:end) = inMeas(1,:); zLines(2,2:3:end) = inMeas(2,:); assignP.XData = zLines(1,:); assignP.YData = zLines(2,:);
Plot truth and state.
truthPos = [truthState(1:2);0]; truthDims = struct('Length',truthState(6),... 'Width',truthState(7),... 'Height', 0,... 'OriginOffset', [0 0 0]); truthOrient = quaternion([truthState(4) 0 0],'eulerd', 'ZYX','frame'); truthP.plotTrack(truthPos',truthDims,truthOrient); statePos = [tgtState(1:2);0]; stateDims = struct('Length',tgtState(6),... 'Width',tgtState(7),... 'Height',0,... 'OriginOffset', [0 0 0]); stateOrient = quaternion([tgtState(4) 0 0],'eulerd', 'ZYX','frame'); stateP.plotTrack(statePos', stateDims, stateOrient);
Input Arguments
states
— Current rectangular states
7-by-N real-valued matrix
Current rectangular states, specified as a 7-by-N real-valued matrix, where N is the number of states. The seven-dimensional rectangular target state is defined as [x; y; s; θ; ω; L; W]:
Variable | Meaning | Unit |
x | Position of the rectangle center in x direction | m |
y | Position of the rectangle center in y direction | m |
s | Speed in the heading direction | m/s |
θ | Orientation angle of the rectangle with respect to x direction | degree |
ω | Turn-rate | degree/s |
L | Length of the rectangle | m |
W | Width of the rectangle | m |
Example: [1;2;2;30;1;4.7;1.8]
Data Types: single
| double
detections
— Detections of target
1-by-M cell array of objectDetection
objects
Detections of target, specified as a 1-by-M cell array of objectDetection
objects. The MeasurementParameters
property (that specifies the transformation from the state-space to measurement-space)
for each object must be the same for all the detections in the cell array.
Output Arguments
measurements
— Expected measurements
P-by-N-by-M real-valued
array
Expected measurements, returned as a
P-by-N-by-M real-valued
array. P is the dimension of each measurement specified in the
detections
input, N is the number of states
specified in the states
input, and M is the
number of detections specified in the detections
input.
Extended Capabilities
C/C++ Code Generation
Generate C and C++ code using MATLAB® Coder™.
Version History
Introduced in R2019b
See Also
trackerPHD
| gmphd
| ctrect
| ctrectmeasjac
| ctrectjac
| initctrectgmphd
| ctrectcorners
MATLAB Command
You clicked a link that corresponds to this MATLAB command:
Run the command by entering it in the MATLAB Command Window. Web browsers do not support MATLAB commands.
Select a Web Site
Choose a web site to get translated content where available and see local events and offers. Based on your location, we recommend that you select: .
You can also select a web site from the following list:
How to Get Best Site Performance
Select the China site (in Chinese or English) for best site performance. Other MathWorks country sites are not optimized for visits from your location.
Americas
- América Latina (Español)
- Canada (English)
- United States (English)
Europe
- Belgium (English)
- Denmark (English)
- Deutschland (Deutsch)
- España (Español)
- Finland (English)
- France (Français)
- Ireland (English)
- Italia (Italiano)
- Luxembourg (English)
- Netherlands (English)
- Norway (English)
- Österreich (Deutsch)
- Portugal (English)
- Sweden (English)
- Switzerland
- United Kingdom (English)