Control Views in the Fixed-Point Tool
The following sections describe how to control the amount of information that is shown in the Fixed-Point Tool. Within the Fixed-Point Tool, you can filter the results that are displayed at a given time by run, or by the subsystem in which the result belongs. You can also add or remove the columns that are shown in the spreadsheet of the Fixed-Point Tool.
Filter Results by Run
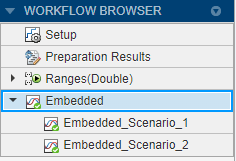
In the Fixed-Point Tool, each time you collect ranges, either through simulation or derived range analysis, or run an embedded simulation, the tool stores the collected information in a run. Using the Workflow Browser, you can filter the results shown in the spreadsheet. Select the runs that you want to view in the spreadsheet.
Filter Results by Subsystem
By default, the Fixed-Point Tool displays only the results for model objects in your specified system under design. To filter the results shown or to see additional results, you can select a different node in the model hierarchy pane. The spreadsheet displays all model objects at and below the selected node.
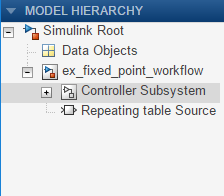
To view the data objects specified in your model, click the Data Objects node in the tree.
Control Column Views
As you follow the workflow for converting your model to fixed point using the Fixed-Point Tool, the tool displays the spreadsheet columns that are most pertinent to your current step in the workflow. If you want to view additional columns, you can add them to the spreadsheet by right-clicking any of the existing column headers.
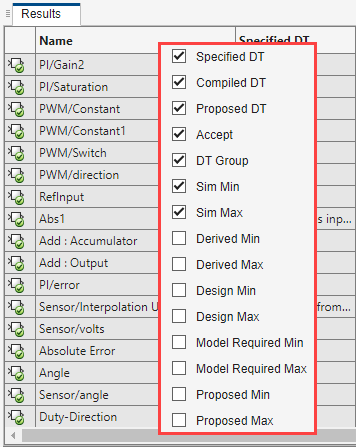
You can sort the results in the spreadsheet by clicking the header of the column on which you want to sort.
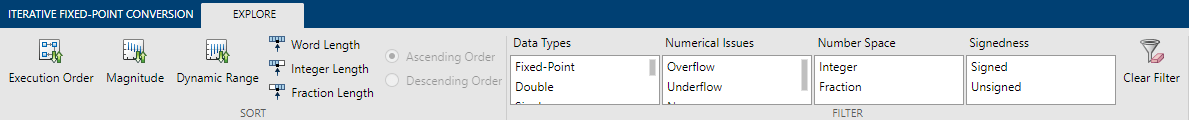
Use the Explore Tab to Sort and Filter Results
Using the Explore tab of the Fixed-Point Tool, you can sort and filter results in the tool based on additional criteria. The Explore tab is available whenever a single run that contains visualization data is selected in the Run Browser of the Fixed-Point Tool.
When there are unapplied proposals in the Fixed-Point Tool, the tool sorts and filters based on the ProposedDT. If there are no unapplied proposals, the tool sorts and filters the results based on the SpecifiedDT. If there is no SpecifiedDT available, for example if the result specifies an inherited data type, then the tool uses the CompiledDT.
Sort
You can sort results based on the following criteria.
| Sorting Criteria | Description |
|---|---|
Execution Order | Order in which the blocks are executed during simulation |
Magnitude | The larger of the absolute values of the SimMin and SimMax |
Dynamic Range | Difference between the value representable by the largest bin and smallest bin in the histogram of logged values |
Word Length | Total number of bits in the data type |
Integer Length | Number of bits devoted to representing integer values in the data type The tool calculates
the integer length as word length
-fraction length. For
example, for the data type
|
Fraction Length | Number of bits in the fractional part of the data type |
By default, the tool sorts in ascending order. To have the tool sort in descending order, select Descending. You can select only one sorting criteria at a time.
Filter
You can filter results based on the following criteria.
| Filter Criteria | Selections |
|---|---|
| Data Types |
|
| Numerical Issues |
|
| Number Space |
|
| Signedness |
|
You can select multiple filtering selections from a criteria category by holding the Ctrl key while you select additional selections. When you select multiple filtering selections from the same criteria category, they are combined using OR logic. When you select multiple filtering selections across different criteria categories, they are combined using AND logic.
You can clear a selection by holding the Ctrl key. To clear
all filters, click the Clear Filter
 button.