Perform Fault Analysis of a Battery Management System
This example shows how to validate a fault analysis on a battery management system (BMS). To represent faults in the physical system, you use Simulink® Fault Analyzer™ to add faults to Simulink signals and Simscape™ Battery™ blocks. After configuring the faults, you can link the faults to a safety analysis spreadsheet, run simulations from the spreadsheet, and analyze the spreadsheet by using the simulation results. The analysis validates whether the BMS can detect the injected faults.
Open the Model
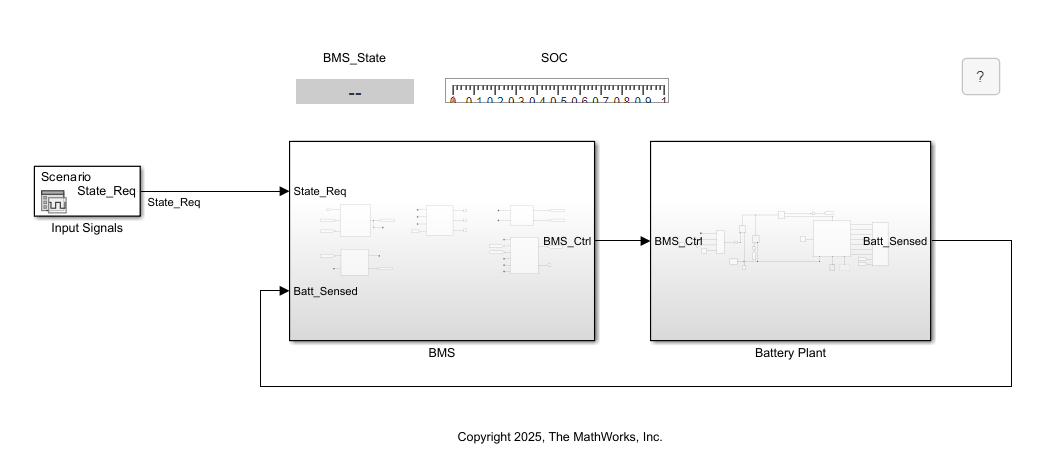
This example uses a project to store the supporting files. After opening the project, the model opens and loads the necessary workspace variables. The model contains subsystems that represent the plant model for the battery and the BMS. A Signal Editor block defines the simulation inputs.
Signal Input Source
The Signal Editor block loads a scenario that outputs three steps during simulation, where each step outputs a different enumerated mode. First, the block outputs the Standby mode for 30 seconds, then outputs the Driving mode for another 100 seconds, and then outputs the Charging mode. To view the input signal, double-click on the Input Signals block and click the Open Signal Editor button ![]() .
.
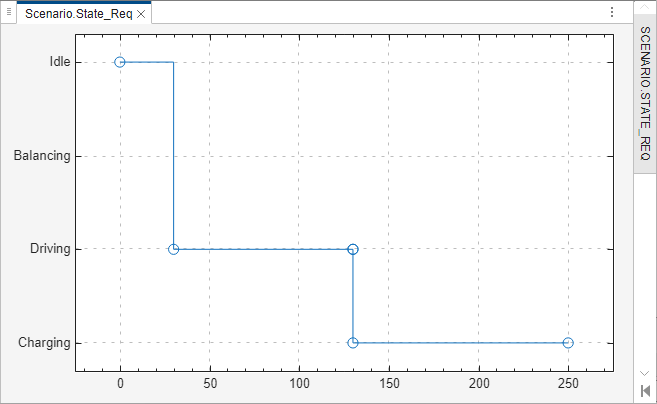
The Signal Editor block uses states defined in the BMS_State_T.m class definition file. You can configure new scenarios with these states in the Signal Editor block and run them on this model.
Battery Plant
To view the plant model, Open the Battery Plant subsystem. The Battery Plant subsystem models a battery pack by using Simulink and Simscape Battery blocks. The model uses the input state, BMS_State, to drive the Current signal value applied to the battery pack. The signal uses the same enumerations in the BMS_State_T.m class definition file. If the BMS_State signal is Fault, the Battery Plant subsystem applies a current of 0 to the battery pack.
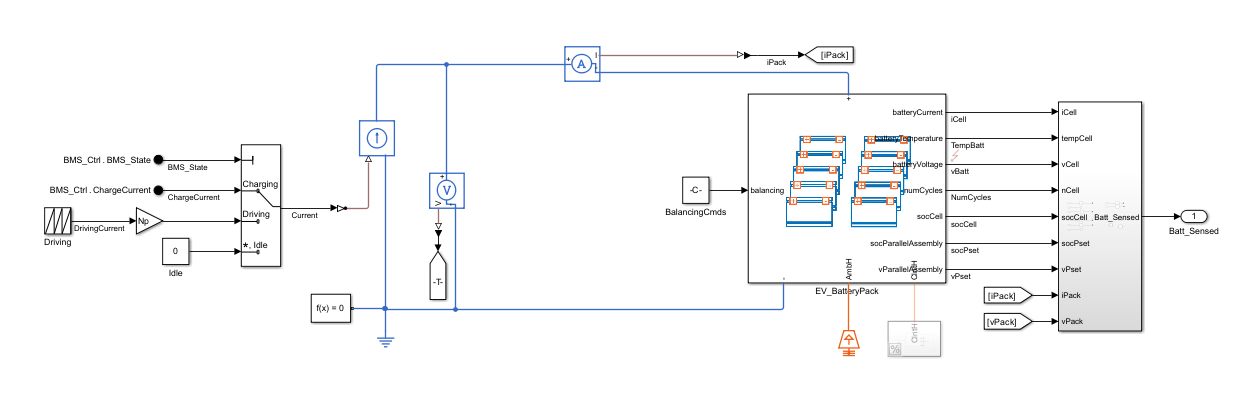
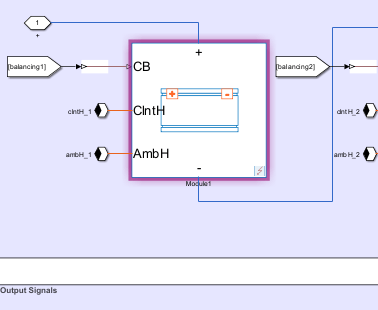
To model the battery pack, the BMS subsystem uses a Pack (Generated Block) (Simscape Battery) block named EV_BatteryPack. You add Pack (Generated Block) blocks interactively by using the Battery Builder (Simscape Battery) app, or generate the block programmatically by using the buildBattery (Simscape Battery) function. In this example, the pack includes two module assemblies, and each assembly includes four modules. For more information on how to build a battery pack, see Build Detailed Model of Battery Pack from Pouch Cells (Simscape Battery).
Battery Management System
To view the BMS logic, open the BMS subsystem. The BMS subsystem contains subsystems that model the supervisory control, state of charge (SOC) estimation, current limit, charging control, and fault monitoring.
Open the Fault Monitoring subsystem. The Fault Monitoring subsystem contains Simscape Battery blocks that can detect overcurrent, undervoltage, overvoltage, faulty sensor, under temperature, and over temperature faults. If the Fault Monitoring subsystem detects a fault for the length of time specified by the FatalFaultQualiTime workspace variable, the subsystem sets the FaultPresent signal to True.
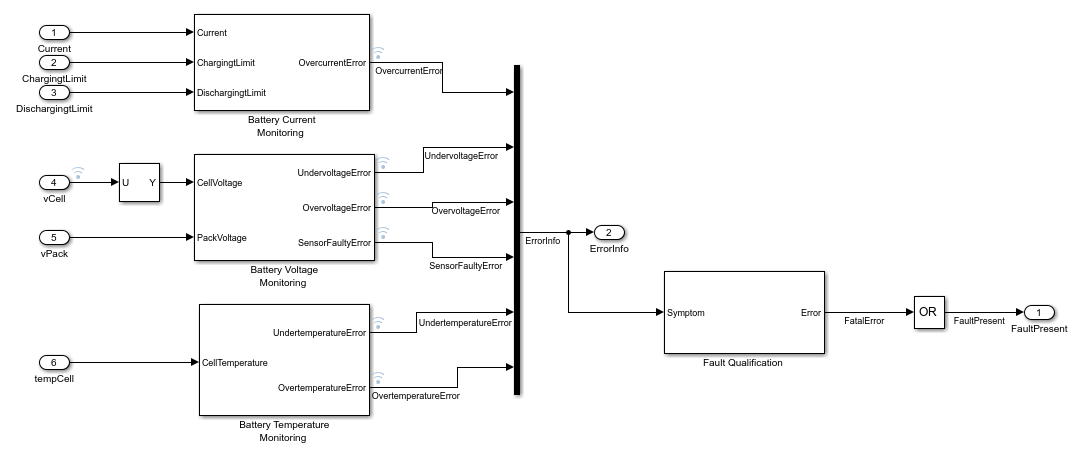
To investigate the logic, look inside the mask of each masked subsystem that the Fault Monitoring subsystem contains. Right-click the subsystem, and in the View Mask row, pause on the arrow, and then click Look Inside Mask.
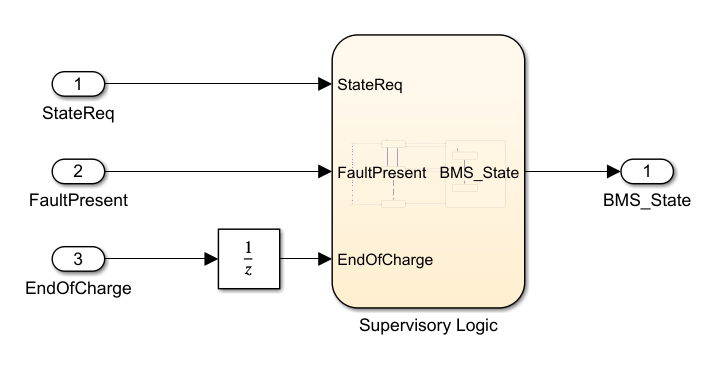
The Fault Monitoring subsystem feeds the FaultPresent signal to the Supervisory Control subsystem. From the top level of the BMS subsystem, open the Supervisory Control subsystem. To determine the battery management state, the Supervisory Control subsystem uses a Stateflow® chart. If the FaultPresent signal is true, the BMS_State signal outputs Fault.
Inspect the Faults
You can add faults to Simulink block input ports, Simulink block output ports, or Simscape blocks. For more information on defining faults in Simulink block ports and Simscape blocks, see Define and Model Faults and Introduction to Simscape Faults (Simscape). This example uses faults in both domains.
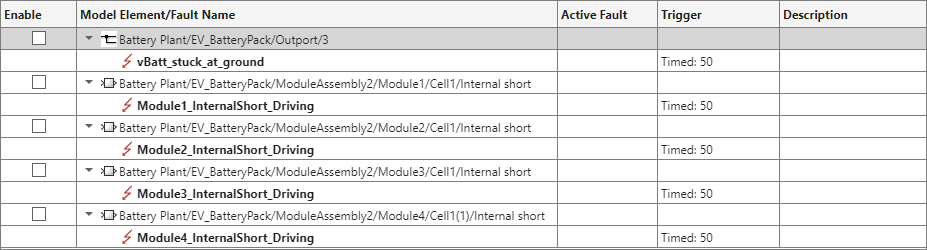
Open the Fault Table pane to view the faults. In the Apps tab, click Fault Analyzer. Then, in the Fault Analyzer tab, in the View section, click Fault Table. Expand each model element to view the faults. The model contains five faults that each have a trigger time of 50 seconds. One of the faults, vBatt_stuck_at_ground, is assigned to the output port of EV_BatteryPack. This fault overrides the signal to ground. The other faults create an internal short in a Module (Generated Block) block. These modules are contained in the Module Assembly (Generated block) block, ModuleAssembly2.
To view the location of a fault, right-click the fault and select Show faulted model element in canvas. The Simulink Editor opens and highlights the location of the fault.
Run a Simulation
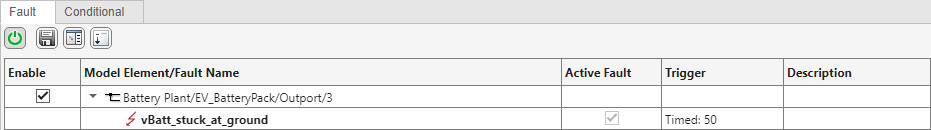
You can simulate one, several, or no faults in a given simulation. For example, to simulate only vBatt_stuck_at_ground, enable the Battery Plant/EV_BatteryPack/Outport/3 model element and disable the other model elements. You can only activate one fault on each model element.
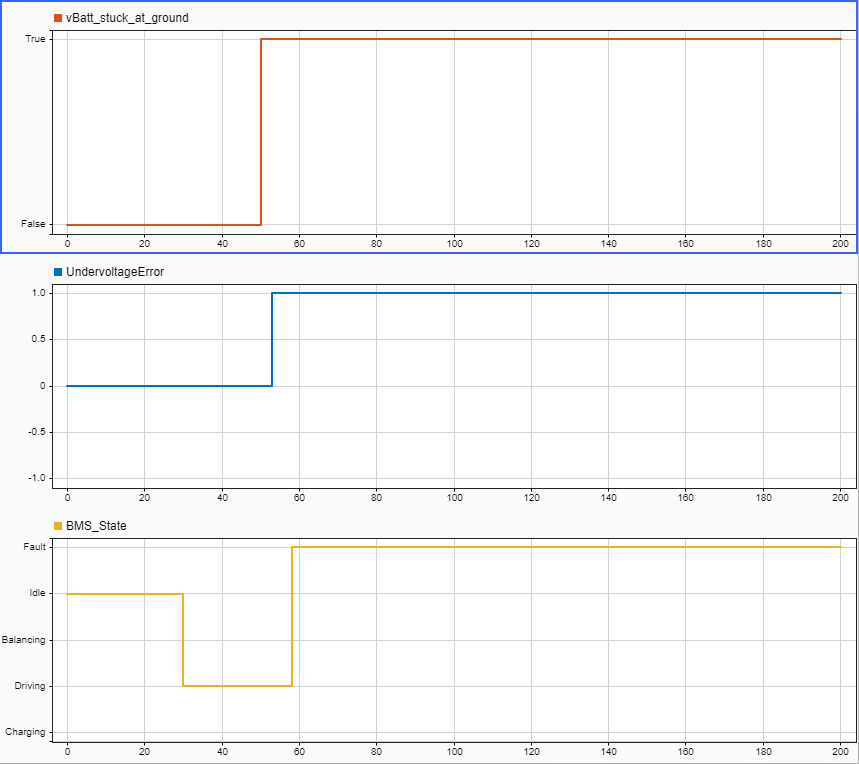
In the Fault Analyzer tab, in the Status Section, ensure the Fault Simulation button is ON. Simulate the model. You can view the results of the simulation in the Simulation Data Inspector. In the Fault Analyzer tab, in the Review Results section, click Data Inspector. This image shows the injection status of the fault, the undervoltageError signal value, and the BMS_State signal value of the simulation you run.
You can simulate with additional activated faults.
Link Faults and Model Elements to Fault Analysis
The SAE J2929 safety standard describes the fault analysis that you perform to validate battery management systems like this one [1]. You create the fault analysis in a spreadsheet that is similar to a Failure Mode and Effects Analysis (FMEA). This analysis often includes how effective mitigation logic, such as safety mechanisms, are at detecting abnormal behavior. With Simulink Fault Analyzer, you create these spreadsheets in the Safety Analysis Manager. After you configure your model, the faults that you want to test, and the fault analysis, you can then link faults to elements in your fault analysis spreadsheets by using Requirements Toolbox™.
In this example, the faults are linked to cell entries in a fault analysis spreadsheet named FaultAnalysisSpreadsheet.mldatx. Open the spreadsheet in the Safety Analysis Manager.
BMSFADoc = safetyAnalysisMgr.openDocument(...
    "FaultAnalysisSpreadsheet.mldatx");
safetyAnalysisMgr.openManager
The fault analysis uses links in three of the columns.
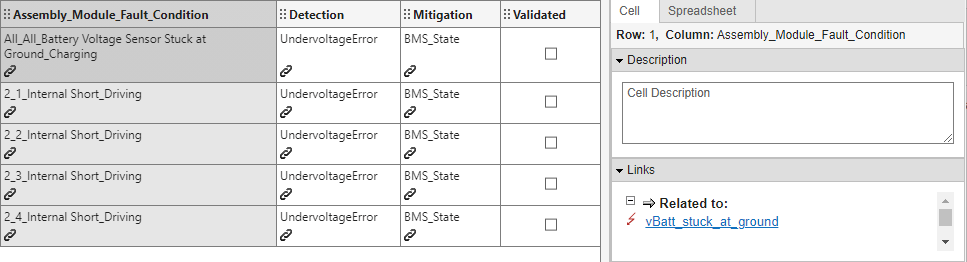
Each cell in the Assembly_Model_Fault_Condition column links to a different fault.
Each cell in the Detection column links to the associated detection logic, which is the
Battery Voltage Monitoringsubsystem.Each cell in the Mitigation column links to the associated mitigation logic, which is the
Supervisory Controlsubsystem.
Point to the link icon ![]() to view the links. You can also view the links by selecting the cell and, in the Properties pane, expanding the Links section.
to view the links. You can also view the links by selecting the cell and, in the Properties pane, expanding the Links section.
Run Callbacks to Simulate and Evaluate Fault Analysis
To analyze the spreadsheet, you create and execute a callback. See Write Callbacks to Analyze Safety Analysis Manager Spreadsheets. In this example, the spreadsheet executes a callback when you click Analyze Spreadsheet. The callback runs the code in the custom MATLAB® function, validateBMSFaultAnalysis. For each row of the spreadsheet with a linked fault in the Assembly_Model_Fault_Condition column, the function activates the fault, deactivates the other faults, and simulates. The function then checks if the linked model artifact in the Detection column is active during simulation. If the fault monitoring system detects the linked fault, the function adds a check flag to the cell in the Detection column. Similarly, if the Supervisory Control subsystem outputs the Fault state when the fault is detected, the function adds a check flag to the cell in the Mitigation column. If both the detection and mitigation mechanisms execute for the fault, the function checks the cell in the Validated column. To view and edit the callback code, open the function in MATLAB.
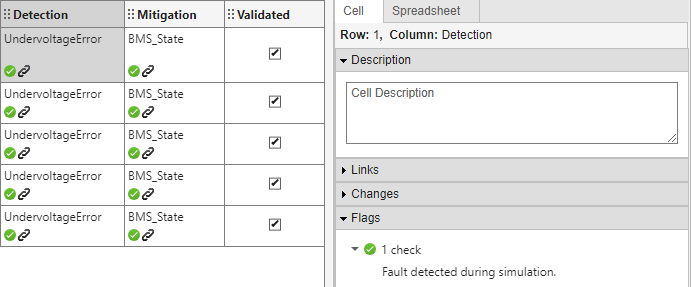
Click Analyze Spreadsheet. When each fault is injected, the callback verifies that the detection and mitigation mechanisms engage, and checks the check boxes in the Validated column. In this example, the callback confirms that the detection and mitigation logic deploy for each linked fault.
runAnalysis(BMSFADoc)
You can add different modes to test to the spreadsheet by adding a row and linking to additional faults, detection mechanisms, and mitigation systems. After validating the model, you can export the spreadsheet to Excel®. See Export Spreadsheet to Excel. The exported spreadsheet includes the status in the Validated column cells.
References
[1] Battery Safety Standards Committee. “Safety Standard for Electric and Hybrid Vehicle Propulsion Battery Systems Utilizing Lithium-Based Rechargeable Cells.” SAE International. Accessed December 9, 2024. https://doi.org/10.4271/J2929_201302.