Price Stock Options Using Binomial Model
This example uses the binomial model to price a stock option. The binomial model assumes that the probability of each possible price over time follows a binomial distribution. Price values can become either one up or one down over any short time period. Plotting these two values over time is known as building a binomial tree. For details about the binomial model, see Pricing and Analyzing Equity Derivatives (Financial Toolbox).
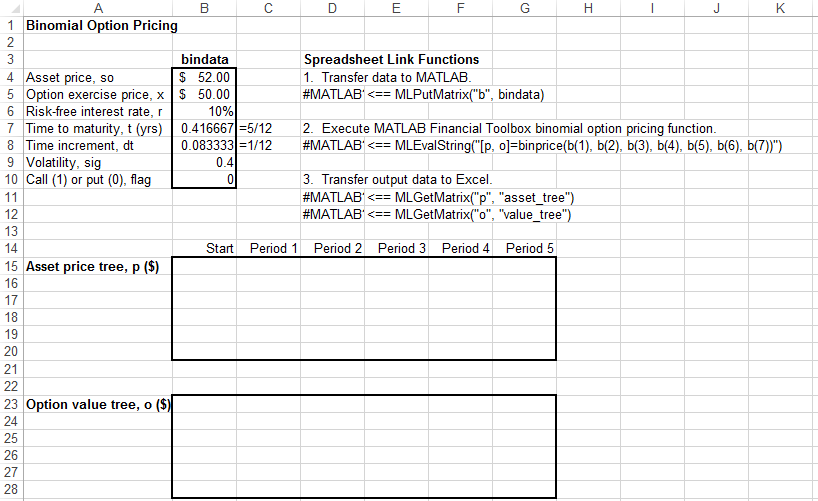
The example organizes and displays the input and output data in a Microsoft® Excel® worksheet. Spreadsheet Link™ functions copy data to a MATLAB® matrix, calculate prices, and return data to the worksheet.
Open the ExliSamp.xls file and select the Sheet4 worksheet.
For help finding the ExliSamp.xls file, see Installation.
This worksheet contains these named ranges:
B4:B10namedbindata. Two cells inbindatacontain formulas:B7contains=5/12B8contains=1/12
B15namedasset_tree.B23namedvalue_tree.
Note
This example requires Financial Toolbox™, Statistics and Machine Learning Toolbox™, and Optimization Toolbox™.
Execute the Spreadsheet Link function that copies the asset data to the MATLAB workspace by double-clicking the cell
D5and pressing Enter.Execute the function that calculates the binomial prices in cell
D8.Copy the price data to the worksheet by executing the functions in cells
D11andD12.The data in the worksheet updates.
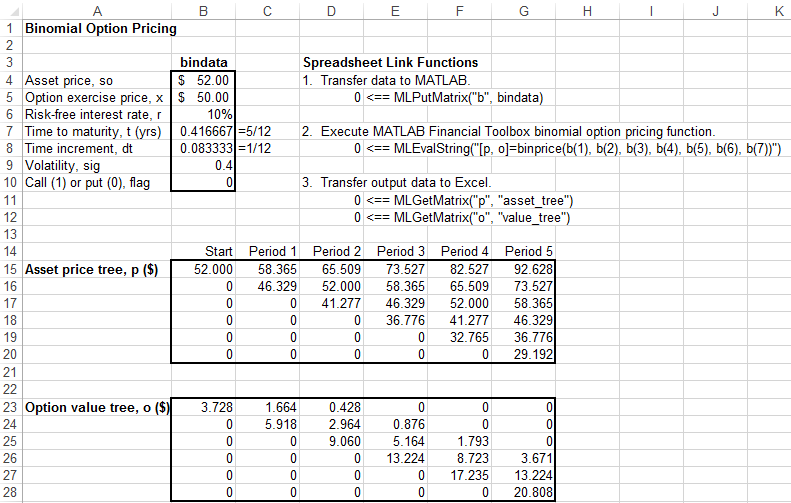
The asset price tree contains these prices:
Period 1 — The up and down prices
Period 2 — The up-up, up-down, and down-down prices
Period 3 — The up-up-up, up-up, down-down, and down-down-down prices
And so on.
The option value tree gives the associated option value for each node in the price tree. The option value is zero for prices significantly above the exercise price. Ignore the zeros that correspond to a zero in the price tree.
You can generate different binomial prices by changing the data
in the cell range B4:B10 and executing the Spreadsheet Link functions
again. If you increase the time to maturity in cell B7 or
change the time increment in cell B8, enlarge the
output tree areas as needed.
See Also
MLGetMatrix | MLPutMatrix | MLEvalString | binprice (Financial Toolbox)