Validate Task-to-CPU Mapping
This example shows you how to analyze task execution across CPUs and perform a CPU feasibility analysis by using the Code Profile Analyzer app and task execution times from a software-in-the-loop (SIL), processor-in-the-loop (PIL), or XCP-based external mode simulation. You can perform the CPU feasibility analysis using these steps:
Map generated tasks to CPUs by applying well-known algorithms.
Observe the effect of the mapping on CPU utilization.
Validate the mapping by using well-known checks that assume the tasks are independent and statically partitioned.
Use the validation results to check that your target hardware can execute generated tasks without encountering scheduling issues, for example, task overrun events where new task instances arrive before previous instances terminate.
Run Simulation and Analyze Task Execution Across CPUs
Open the model.
open_system('TaskToCPUMapping');Configure an XCP-based external mode simulation.
set_param(gcs,SimulationMode="external");
set_param(gcs,SolverType="Fixed-step");
set_param(gcs,ExtMode="on");

cs = getActiveConfigSet(gcs);
index = Simulink.ExtMode.Transports.getExtModeTransportIndex(cs,"XCP on TCP/IP");
set_param(gcs,ExtModeTransport=index);

set_param(gcs,GenerateSampleERTMain="on");
set_param(gcs,TargetOS="BareBoardExample");

set_param(gcs,ReturnWorkspaceOutputs="off");
Treat each discrete rate as a separate task.
set_param(gcs,EnableMultiTasking="on");Enable code execution profiling.
set_param(gcs,CodeExecutionProfiling="on");
set_param(gcs,CodeProfilingInstrumentation="off");
Start the simulation.
set_param(gcs,SimulationCommand="start");At the end of the simulation, open the Code Profile Analyzer app.
isExternalSimulationActive = true;
while isExternalSimulationActive
    pause(0.1);
    simStatus = get_param(gcs,"SimulationStatus");
    isExternalSimulationActive = ~strcmp(simStatus,'stopped');
end
coder.profile.show(executionProfile);
In the app, click the CPU Usage tab, which enables you to:
View and assess the workload of each CPU.
Investigate how the scheduler performs load balancing.
For each CPU, the Detailed Workload Distribution Across CPUs During Simulation section displays, as a percentage, the times spent idling and running each generated task. For the CPU in the selected row, the Task Distribution on the Selected CPU pie chart also displays the same information.
You can use the Summary of Workload Distribution Across CPUs During Simulation pie chart to check whether the scheduler performs load balancing effectively.
The rest of this example shows how you can use the Task Validation tab to perform a CPU feasibility analysis for your target hardware.
Task Validation Sections
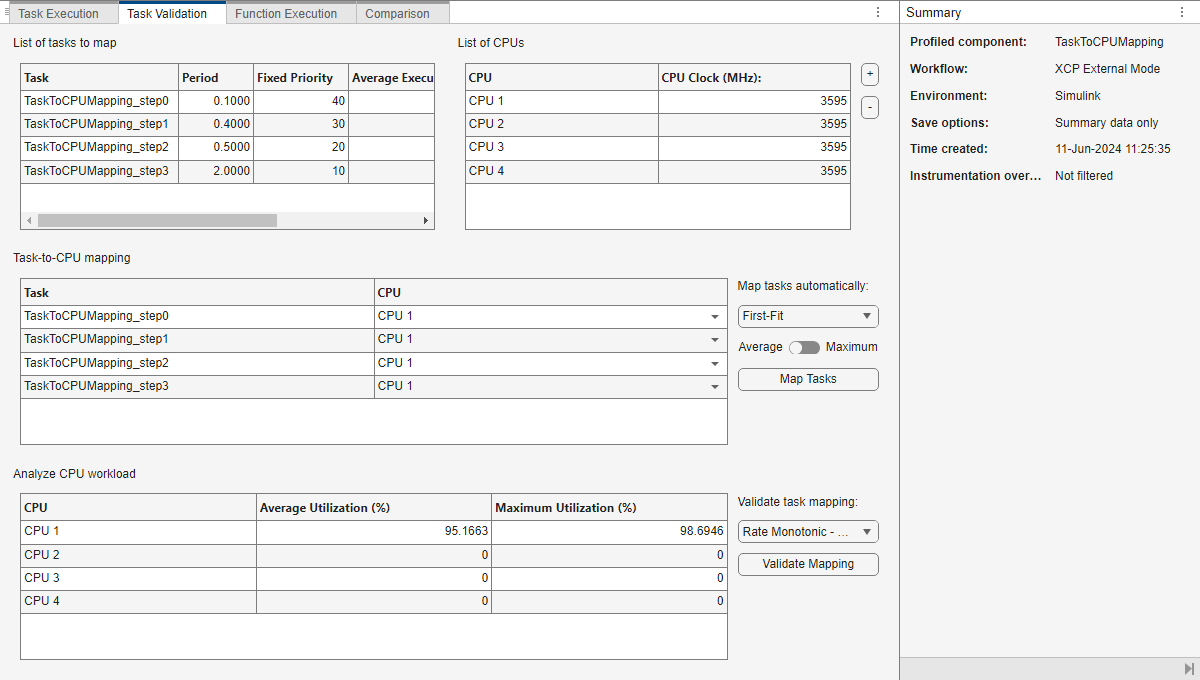
In the app, click the Task Validation tab, which provides four sections: List of tasks to map, List of CPUs, Task-to-CPU mapping, and Analyze CPU workload.
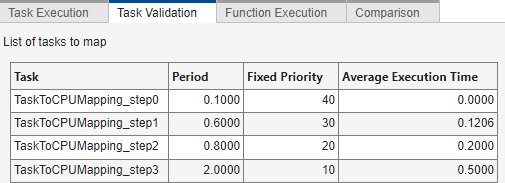
The List of tasks to map section displays information about tasks generated from the profiled component:
Task – Task name.
Period – Sample period. You can edit this column.
Fixed Priority – Relative importance of the task. A higher value indicates a higher priority. The initial generation of values assumes that the scheduling is rate-monotonic. You can edit this column.
Average Execution Time – Average time between the start and end of the task.
Maximum Execution Time – The longest time between the start and end of the task.
The List of CPUs section initially shows the following:
For XCP-based external mode simulations, the timer frequency for each CPU on the target hardware.
For SIL or PIL simulations, the timer frequency for the first CPU.
You can modify the timer frequency (Timer Ticks per Second (MHz)) values.
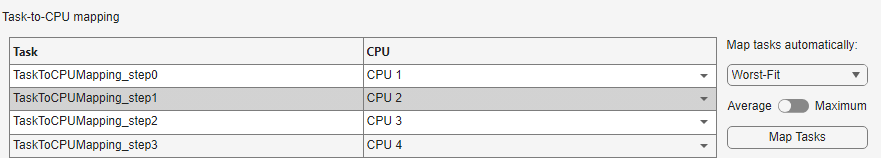
In the Task-to-CPU mapping section, you can map a generated task to an available CPU, that is, you can statically set the CPU affinity for each task. When you open the Code Profile Analyzer app, it initially assigns all tasks to the first CPU. To create the task-to-CPU mapping, you can:
Manually map tasks to CPUs.
Use an algorithm from the Map tasks automatically list. For the algorithm, you must specify the use of average (default) or maximum task execution times. For a list of algorithms, see Select Algorithm for Task-to-CPU Mapping.
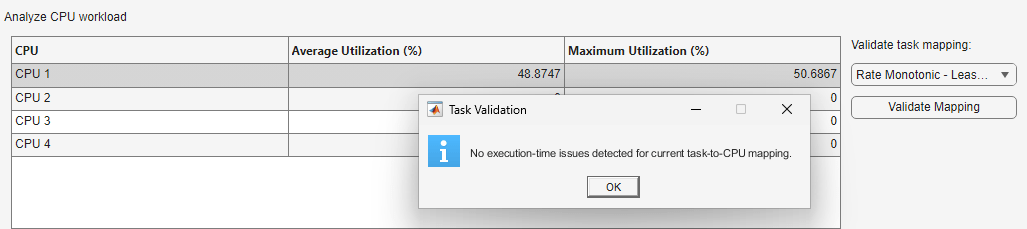
The Analyze CPU workload section shows, in the Average Utilization (%) and Maximum Utilization (%) columns, the percentage of time that each CPU is busy running the mapped tasks. To validate CPU utilization for the mapped tasks, click Validate Mapping. Depending on the task scheduling algorithm, execution issues can arise even when a CPU is not fully loaded. For a list of algorithms, see Select Scheduler and Algorithm for Task Mapping Validation.
Perform Mapping and Validation
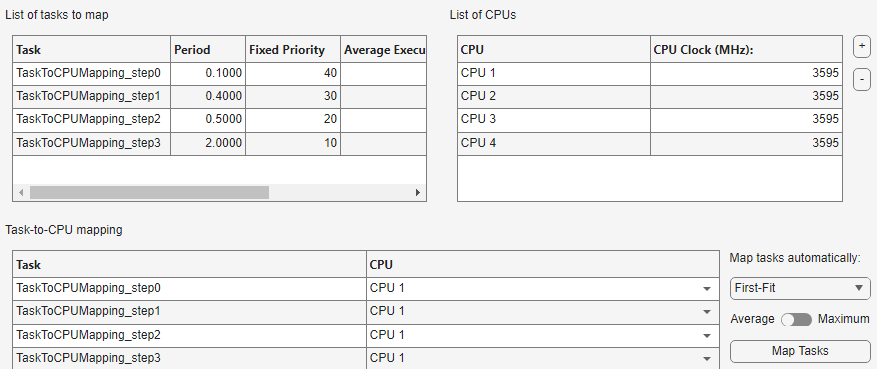
To make the viewing of results for this example easier, on the toolstrip, in the Time unit field, specify Seconds (s). In the List of tasks to map section, note the periods and average execution times of these tasks:
TaskToCPUMapping_step1– Executed every 0.4 s and takes 0.12 sTaskToCPUMapping_step2– Executed every 0.5 s and takes 0.20 sTaskToCPUMapping_step3– Executed every 2.0 s and takes 0.50 s
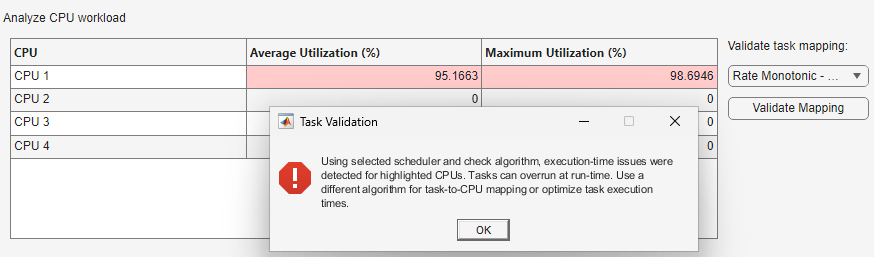
Using the initial mapping and default scheduler and check algorithm (Rate Monotonic - Least Upper Bound), click Validate Mapping. The validation process produces a warning, indicating that tasks can overrun.
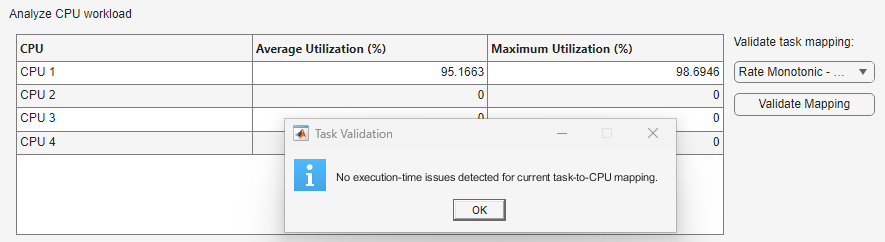
From the Validate task mapping list, select Rate Monotonic – Response Time Analysis. Then click Validate Mapping.
Compared to the default algorithm, which checks an upper bound, Rate Monotonic – Response Time Analysis is exact and expensive - see Select Scheduler and Algorithm for Task Mapping Validation. Although the validation process does not detect overrun issues, the CPU utilization value is high. To address the problem, use one of these approaches:
Map Tasks Manually
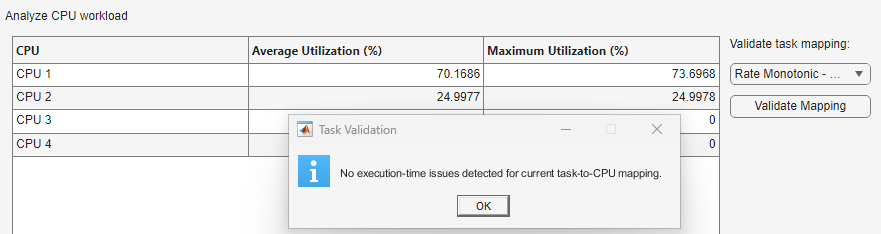
In the Task-to-CPU mapping section, on the TaskToCPUMapping_step3 row, select CPU 2 from the CPU cell list. Then, click Validate Mapping.
Using another CPU causes the utilization value for CPU 1 to decrease.
Use Automatic Task Mapping
From the Map tasks automatically list, select Worst-Fit. Then, click Map Tasks, which maps the tasks to available CPUs.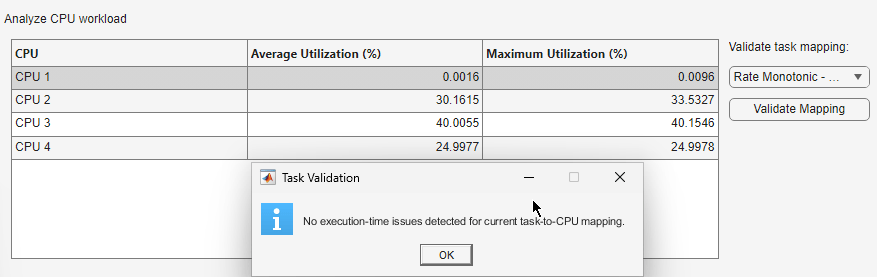
Click Validate Mapping.
The validation process shows moderate utilization values for the CPUs.
Increase Sample Periods
In the List of tasks to map section, increase the sample periods for the tasks. For example, for
TaskToCPUMapping_step1, change 0.4 s to 0.6 s and forTaskToCPUMapping_step2, change 0.5 s to 0.8 s. Tasks execute less frequently, which provides more CPU headroom.Use the initial mapping. From the Map tasks automatically list, select
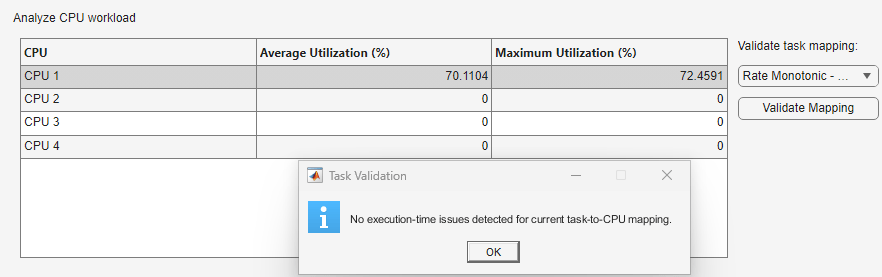
First-Fit. Then, click Map Tasks.Use the default scheduler and check algorithm. From the Validate task mapping list, select
Rate Monotonic - Least Upper Bound. Then, click Validate Mapping.
The validation process does not detect overrun issues and displays a moderate CPU utilization value. Although you resolve the schedulability issue, changing sample periods might affect your algorithm. Use this approach carefully.
Use Faster CPU
Consider the task set with the initial period values and mapping.
If you use the default scheduler and check algorithm (Rate Monotonic - Least Upper Bound), the validation process produces a warning, indicating that tasks can overrun.
To specify a faster CPU, in the List of CPUs section, change the Timer Ticks per Second (MHz) value for CPU 1 to a higher value. Then, click Validate Mapping.
The validation process does not detect overrun issues and displays a moderate CPU utilization value.
Check Fixed-Priority Scheduling
If your target hardware does not use rate-monotonic scheduling, you can check schedulability for a fixed-priority task set. Use this task set and the corresponding fixed-priority values.

To check task schedulability:
From the Validate task mapping list, select
Fixed Priority – Response Time Analysis.Click Validate Mapping. The validation process does not detect execution-time issues for the specified task-to-CPU mapping.
In the Lists of tasks to map section, for TaskToCPUMapping_step3, increase the Fixed Priority value to 25. The priority of TaskToCPUMapping_step3 is now higher than the priority of TaskToCPUMapping_step2, so TaskToCPUMapping_step3 can preemt TaskToCPUMapping_step2. You can expect overrun events for TaskToCPUMapping_step2.
Click Validate Mapping.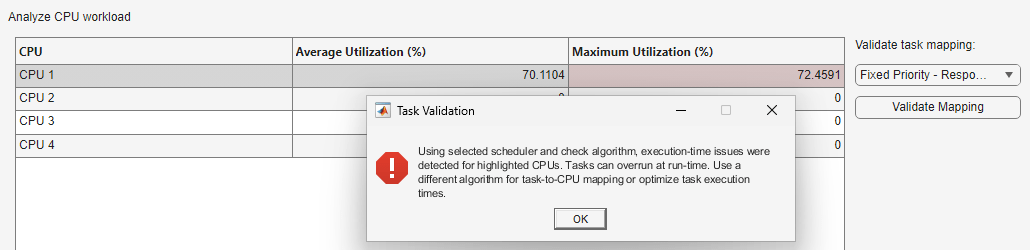
The validation process indicates that tasks can overrun.
Select Algorithm for Task-to-CPU Mapping
You can control task-to-CPU mapping by specifying an algorithm. From the Map tasks automatically drop-down list, select one of these options:
First-Fit– Assigns a task to the first available CPUBest-Fit- Assigns a task to the CPU with the smallest resources that can accommodate the task utilizationWorst-Fit– Assigns a task to the CPU with the biggest resources that can accommodate the task utilizationFirst-Fit Decreasing– Similar toFirst-Fitbut sorts tasks from highest to lowest utilizationBest-Fit Decreasing– Similar toBest-Fitbut sorts tasks from highest to lowest utilizationWorst-Fit Decreasing– Similar toWorst-Fitbut sorts tasks from highest to lowest utilizationRound Robin– Does not consider task utilization but assigns tasks to CPUs in a round-robin fashion, aiming for an even distribution
The First-Fit, Best-Fit, and Worst-Fit algorithms do not use a defined order when mapping tasks to CPUs.
Select Scheduler and Algorithm for Task Mapping Validation
You can select a scheduler and algorithm for validating the task-to-CPU mapping. From the Validate task mapping list, select one of these options:
Rate Monotonic - Least Upper BoundRate Monotonic – Response Time AnalysisFixed Priority – Response Time Analysis
Rate-monotonic scheduling assigns fixed priorities to tasks by using their periods: the shorter the period, the higher the task priority.
Fixed-priority scheduling assigns priorities to tasks statically. The List of tasks to map section displays the priority values in the Fixed Priority column.
The Rate Monotonic - Least Upper Bound option uses rate-monotonic scheduling with the least upper bound check. The validation process verifies that the total CPU utilization is less than an upper bound that is dependent on the number of tasks:
is the total CPU utilization
is the computation time for task
is the sample period for task
is the number of tasks that require scheduling
For two tasks, the validation process verifies that the total CPU utilization is less than 82%. As the number of tasks becomes large, the upper bound converges to 69%. For more information, see Rate-Monotonic Scheduling.
The Rate Monotonic – Response Time Analysis option uses rate-monotonic scheduling with the response time analysis check, which verifies that the worst-case response time for each task is not greater than the task period. The task response time is the interval between the time when the task is ready for execution and the time when execution is complete, taking into account execution of the task and all higher priority tasks. The worst-case execution assumes that all tasks are ready at the same time. Higher priority tasks preempt the task under analysis, which increases the task response time. The validation process iteratively computes the response time for task :
is the worst-case execution time of task , and is the set of tasks with priorities higher than task . The iterations continue until .
The Fixed Priority – Response Time Analysis option uses fixed-priority scheduling with the response time analysis check.
Close Model
Close the model.
close_system(gcs,0);