Perform Multicore Analysis for Dataflow
When a system is configured to use a dataflow execution domain, the Multicore tab is activated on the Simulink® toolstrip. This tab consolidates multicore analysis techniques leveraged in dataflow into an incremental and iterative workflow.
Using the controls on the Multicore tab, you can:
Estimate the relative cost of blocks using internal Simulink heuristics.
Profile dataflow multicore simulations.
Measure average execution times (cost) of blocks inside the dataflow subsystems by simulating the model with software-in-the-loop (SIL) or processor-in-the-loop (PIL) profiling. This functionality requires an Embedded Coder® license.
Manually override the block cost values.
Provide analysis constraints, such as maximum number of threads and threading threshold.
Run analysis to generate a block-to-threads allocation and visualize analysis results.

This chart illustrates the steps of multicore analysis. After you specify the dataflow execution domain for a system, you can select a cost calculation method, overwrite block costs, specify analysis constraints, run analysis, and review results.

Select the Cost Calculation Method
On the Multicore tab, in the Mode section, you can select the method of cost calculation as Simulation Profiling, Cost Estimation, or SIL/PIL Profiling. The cost of individual blocks will be automatically determined and used in the multicore analysis for equal distribution of the computational load across multiple CPU cores.

Simulation Profiling
Use Simulation Profiling to:
Profile dataflow multicore simulations.
Display simulation multicore analysis data including cost data, latency suggestions, number of threads, thread highlighting, and pipeline delays annotations.
When Simulation Profiling is selected, the Profile Simulation button is disabled and the Run Analysis button is enabled.

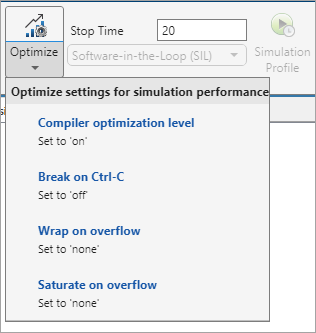
When you perform simulation profiling, use the Optimize button to optimize settings for simulation performance. Button is enabled for only Simulation Profiling option.

Cost Estimation
Use Cost Estimation for:
Quick analysis without running the simulation or generating code.
Preliminary analysis when the model is not fully implemented. In this case, you can modify the results of the estimation to match the anticipated cost values for the final implementation.
When you click Estimate Cost, the Cost Editor displays the estimated execution cost of each block in your model without simulating it.

SIL/PIL Profiling
Use the software-in-the-loop (SIL) or processor-in-the-loop (PIL) profiling method (requires Embedded Coder license) to:
Acquire accurate cost values measured on the host computer using the generated code. The generated code is the closest to the code that will be deployed on the hardware.
Measure cost values on the actual target hardware in order to maximize the utilization of cores when the final code is deployed.
SIL/PIL profiling measures average execution times (cost) of blocks inside the dataflow system by simulating the model with SIL/PIL.

Use Settings to configure C/C++ code generation and hardware implementation settings.
Use Stop Time to specify the time to measure the cost.
Use the list to select the
Software-in-the-Loop (SIL)orProcessor-in-the-Loop (PIL)setting.Use Profile to measure the costs associated with blocks with the specified settings.
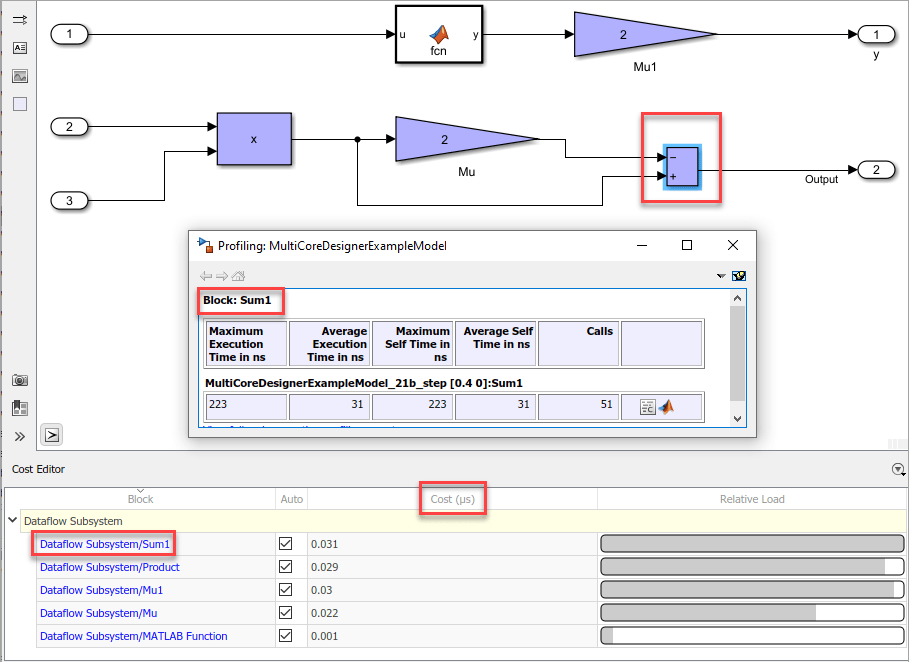
This example shows the highlighted block in the model and its cost. Observe that Cost Editor displays the units of the profiled cost values when you perform SIL/PIL profiling.

Manually Change Block Costs
In Cost Estimation and SIL/PIL Profiling modes, you can manually change the block cost values to understand their impact to the multicore behavior. To override block costs, clear the Auto column for the corresponding block and edit the value in the Cost column.
Overwriting block costs values allows you to perform analysis for custom costs.

The costs are not editable in Simulation Profiling mode.
Specify Analysis Constraints and Run Analysis
Next, set constraints and run multicore analysis. In the Analyze section:

Use Maximum Number of Threads to specify the maximum number of threads produced by the analysis. By default, the tool automatically tries to determine the number of cores of the target processor from the hardware settings and uses that as maximum number of threads. If the tool is unable to determine the exact value, it will use the number of cores on the host platform as the maximum number of threads.
Specify the Multithreading Threshold to set a minimum for the total cost (in microseconds) of the system, for which the tool applies multithreading. If the total cost falls below the threshold, the tool will not partition the system. By default, the tool uses a nominal value, 25 micro- seconds, as the threshold.
Click Run Analysis to perform the analysis based on your configuration.
Review Results
Use the tools provided in the Review Results section to visualize and understand the multicore behavior of your model.

Highlight and View Threads
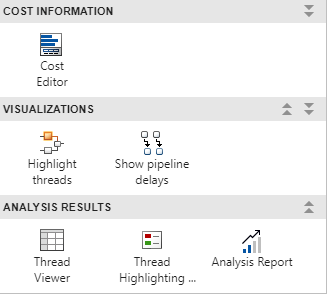
Select Highlight threads to highlight and visualize the threads and the assignment of blocks to the threads based on the block execution cost values.

Select Thread Viewer to visualize the allocation of blocks to threads.

Dataflow Analysis Report
Analyze the Suggestions for Increasing Concurrency section to see if there are suggested latencies for pipelining delays. By pipelining the data-dependent blocks, the Dataflow Subsystem block can increase concurrency for higher data throughput. For more information about pipelining delays, see Multicore Simulation and Code Generation of Dataflow Domains. The speedup analysis is not supported in Simulation Profiling mode.

After accepting suggested latencies for pipelining delays, you can use Show pipeline delays to visualize the delays in your model.

Use the analysis report to investigate the relative weight of dataflow systems and the maximum theoretical speedup for the entire model. This speedup can be achieved as a result of the partitioning performed during the analysis. The amount of speedup is proportional to the relative weight of dataflow systems with respect to the entire model.
The analysis report displays total cost and number of threads values for each Dataflow Subsystem block.

The speedup is calculated using this formula, where
n is the total number of Dataflow
Subsystem blocks, pctPar is the percentage of the parallel
execution of a subsystem, and criticalPathCost is the cost of the most
costly thread in a subsystem.
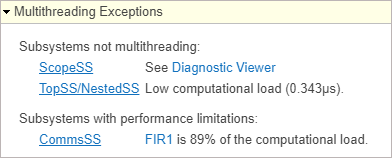
The Dataflow Analysis Report also displays multithreading exceptions as a table when applicable.

The Multithreading Exceptions table displays three types of messages:
No multithreading in any subsystems due to model configuration — This message displays when a model configuration causes all multicore dataflow to be disabled, for example, when multithreading is not supported for protected models.

Subsystems not multithreading — This message displays when a subsystem is executed using a single thread due to an unsupported feature or a block or insufficient work. For example, the Scope block is not supported for multithreading. The message also displays subsystems with insufficient work for multithreading. In this scenario, the message displays the computational load in microseconds.

Subsystems with performance limitations — This message displays when a block is significantly more computationally intensive than other blocks and limits the throughput. This message indicates that the subsystem can not execute faster than the specified block. If a block is more than
90%of the computational load, this causes subsystem to be executed using a single thread and the message displays the subsystems that are not multithreading.