Multicore Analysis Using a Dataflow Domain
This example shows how to analyze the multicore execution behavior of a dataflow domain in Simulink®.
Create a Family Radio Service System
The model in this example uses the Digital Up-Converter (DUC) and Digital Down-Converter (DDC) blocks to create a Family Radio Service (FRS) transmitter and receiver. The DUC block converts a complex digital baseband signal to real passband signal. The DDC block converts the digitized real signal back to a baseband complex signal.
Open familyRadioServiceMulticoreAnalysisExample model.
model_name = 'familyRadioServiceMulticoreAnalysisExample';
open_system(model_name);

Specify Dataflow Execution Domain
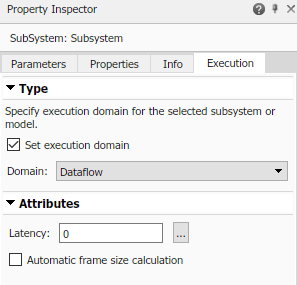
In Simulink®, to specify dataflow as the execution domain for a subsystem, use Property Inspector to set the Domain parameter to Dataflow. You can view this by selecting the subsystem and then accessing Property Inspector. To access Property Inspector, in the Simulink Toolstrip, on the Modeling tab, in the Design gallery select Property Inspector or on the Simulation tab, Prepare gallery, select Property Inspector. Select Set execution domain, then click Domain and select Dataflow. You can also use a Dataflow Subsystem block from the Dataflow library of the DSP System toolbox to get a subsystem that is preconfigured with the dataflow execution domain.

set_param([model_name,'/Dataflow Subsystem'],'SetDomainSpec','on');
set_param([model_name,'/Dataflow Subsystem'],'DomainSpecType','Dataflow');
set_param([model_name,'/Dataflow Subsystem'],'Latency','0');
set_param([model_name,'/Dataflow Subsystem'],'AutoFrameSizeCalculation','off');
Perform Multicore Analysis Using SIL Profiling
After specifying the dataflow execution domain, Multicore tab opens on the Simulink toolstrip.

On the Multicore tab, click Simulation Profiling. From the list, select SIL/PIL Profiling.

Click Profile.

Once profiling finishes, the cost values display in the Cost Editor. Here, average execution time (cost) for each block is displayed in microseconds. The relative load of each block with respect to the most expensive block within the dataflow subsystem is indicated with bars of different length.

For example, the DDC block is the most expensive block in the table and has a cost of 117035 microseconds. Click on the block name in the Block column to highlight the corresponding block in the block diagram.

Click Run Analysis.

After analyzing the model, the Thread Highlighting Legend opens. The Thread Highlighting Legend shows one thread because the data dependency between blocks in the model prevents blocks from being executed concurrently. The Analysis Report and Suggestions pane that appears at the right of the canvas shows how to increase concurrency and obtain higher data throughput by pipelining the data-dependent blocks.

The Dataflow Subsystem specifies a latency value of 0. The suggested latency for the system is 3.
Click the Accept button to use the recommended latency for the Dataflow Subsystem and rerun the analysis. This value can also be entered directly in the Property Inspector for Latency parameter. Simulink shows the Latency parameter value using  tags at the output ports of the dataflow subsystem.
The Thread Highlighting Legend now shows two threads indicating that the blocks inside the dataflow subsystem can be executed in two parallel threads.

Inserted pipeline delays are shown in the canvas using  tags.
tags.

Check Analysis Report
At the bottom of the Analysis Report and Suggestions pane, the maximum theoretical speedup is shown as 1.51x for the model as a result of the partitioning performed during the analysis.

Manually Override Cost
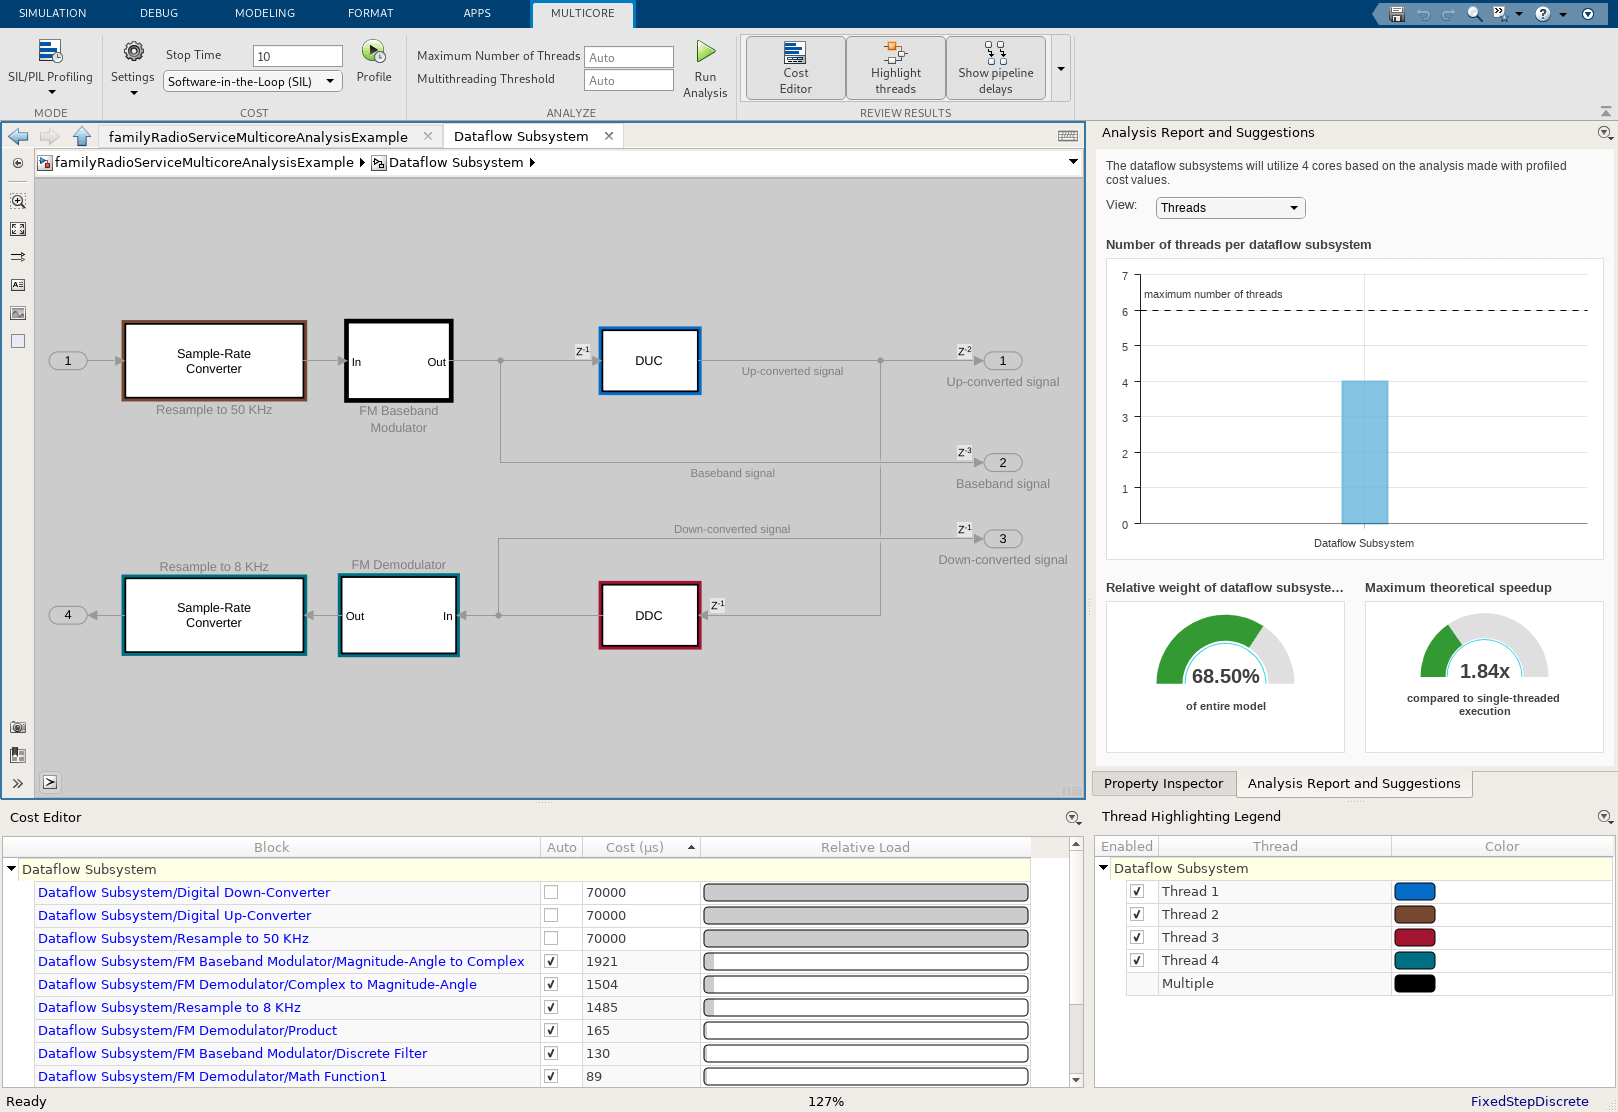
To perform design space exploration, you can manually change the cost of the blocks. The first two blocks are relatively more expensive than other blocks in the subsystem, which should significantly influence how the blocks are mapped to threads. Divide the total sum of the cost for the first two blocks by three, then manually assign that number to the first three blocks by clearing checkboxes in the Auto column and editing the values in the Cost column.

Click Run Analysis to rerun the analysis, then accept the provided latency suggestion. The new result indicates that the subsystem is now partitioned into four threads with a corresponding theoretical speedup value of 1.84x.
