visualize
Visualize frequency response of individual filter stages or sum of filter paths between input and output channels
Since R2024b
Description
visualize( visualizes the frequency
response of the individual filters of the input filter object.filtObj)
visualize(___,
visualizes the frequency response of the filter with additional properties specified by one
or more name-value arguments.Name=Value)
For example, to visualize the frequency response of the sum of all filter paths between
each input and output channel, set SumFilterPaths to
true.
Example: visualize(filtobj,SumFilterPaths=true,NumInputChannels=2)
DFV = visualize(___)dsp.DynamicFilterVisualizer object which contains the settings to customize the
filter visualization.
Examples
Use the visualize function to visualize the frequency response of the individual filters in a SIMO system and the sum of the filters between each input channel and output channel pair. The SIMO system models one input channel, two output channels, and two paths between each input channel and output channel pair.
Design four lowpass FIR filters with varying cutoff frequencies. The filter order for each filter is 400.
order = 4000;
num  = [ % Path 1, Output Channel 1
    designLowpassFIR(FilterOrder=order,CutoffFrequency=0.2);...
    % Path 2, Output Channel 1
    designLowpassFIR(FilterOrder=order,CutoffFrequency=0.3);...
    % Path 1, Output Channel 2
    designLowpassFIR(FilterOrder=order,CutoffFrequency=0.4);...
    % Path 2, Output Channel 2
    designLowpassFIR(FilterOrder=order,CutoffFrequency=0.5)];
Initialize the dsp.MIMOFIRFilter with the array of filters.
simoFilt = dsp.MIMOFIRFilter(num,NumPaths=2)
simoFilt =
  dsp.MIMOFIRFilter with properties:

       NumeratorSource: 'Property'
             Numerator: [4×4001 double]
              NumPaths: 2
    SumFilteredOutputs: true
Visualize the frequency response of the four individual filters. Update the title of the filter visualizer using the Title property of the visualization handle.
vizHandle = visualize(simoFilt)
vizHandle =
  dsp.DynamicFilterVisualizer handle with properties:

               FFTLength: 8192
     NormalizedFrequency: 1
          FrequencyRange: [0 1]
                  XScale: 'Linear'
        MagnitudeDisplay: 'Magnitude (dB)'
    PlotAsMagnitudePhase: 0
                PlotType: 'Line'
             AxesScaling: 'Auto'

  Show all properties
vizHandle.Title = "Magnitude Response of Individual Filters";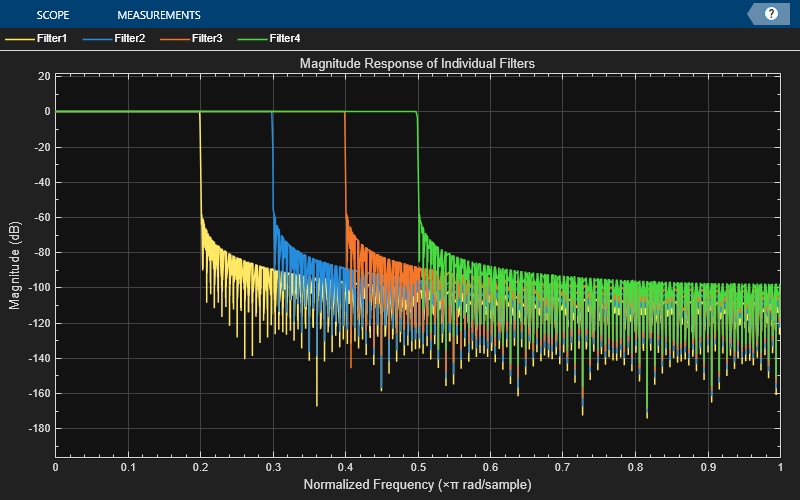
Visualize the frequency response of the sum of all the filters between each input channel and output channel by setting the SumFilterPaths to true.
To use the SumFilterPaths property, you must pass input data to the MIMO FIR filter object or set the NumInputChannels property of the visualize function to a positive integer. In this case, set NumInputChannels to 1.
vizHandle = visualize(simoFilt,NumInputChannels=1,SumFilterPaths=true);
Update the filter visualizer title accordingly.
vizHandle.Title = "Magnitude Response of Sum of Filter Paths";
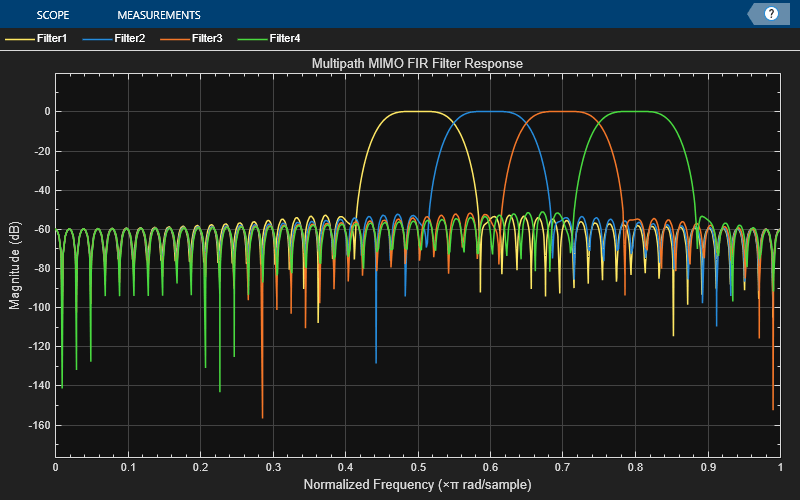
Design four bandpass FIR filters, each with a different center frequency, specified in normalized frequency units. The bandwidth for each filter is 0.1. The SIMO system models one input channel, two output channels, and two paths between each input channel and output channel pair.
bw = 0.1;
num = [ % Path 1, Output Channel 1
    designBandpassFIR(CenterFrequency=0.5,bandwidth=bw);...
    % Path 2, Output Channel 1
    designBandpassFIR(CenterFrequency=0.6,bandwidth=bw);...
    % Path 1, Output Channel 2
    designBandpassFIR(CenterFrequency=0.7,bandwidth=bw);...
    % Path 2, Output Channel 2
    designBandpassFIR(CenterFrequency=0.8,bandwidth=bw)];
Initialize the dsp.MIMOFIRFilter object with the array of filters. Set the number of filter paths to 2.
simoFilt = dsp.MIMOFIRFilter(num,NumPaths=2)
simoFilt =
  dsp.MIMOFIRFilter with properties:

       NumeratorSource: 'Property'
             Numerator: [4×101 double]
              NumPaths: 2
    SumFilteredOutputs: true
Visualize the frequency response of the individual filter stages using the visualize function.
visualize(simoFilt)
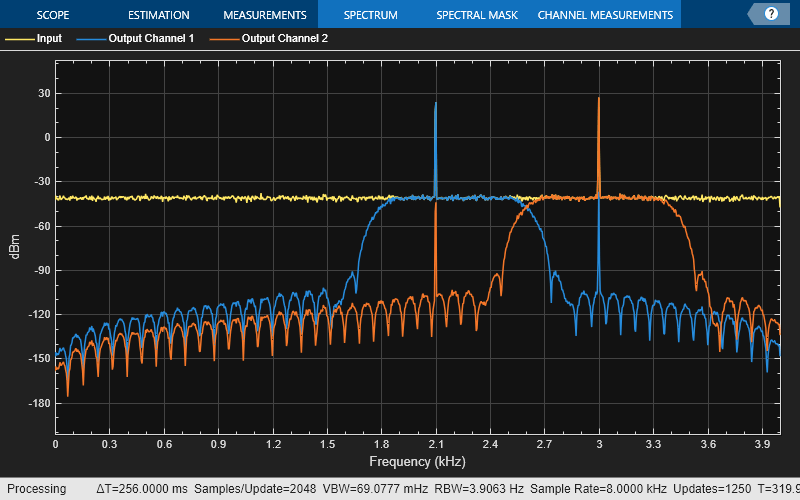
The input contains two sinusoidal signals, each with a frame length of 256. The first sinusoidal signal has a frequency of 2100 Hz and the second sinusoidal signal has a frequency of 3000 Hz.
Fs   = 8000;
frameLen  = 256;
sin_2100Hz = dsp.SineWave(Frequency=2100,SampleRate=Fs,...
    SamplesPerFrame=frameLen);
sin_3kHz  = dsp.SineWave(Frequency=3e3,SampleRate=Fs,...
    SamplesPerFrame=frameLen);
Initialize a spectrumAnalyzer object to view the spectrum of the input and the filtered output.
specScope = spectrumAnalyzer(SampleRate=Fs,PlotAsTwoSidedSpectrum=false,...
    ChannelNames={'Input','Output Channel 1',...
    'Output Channel 2'},ShowLegend=true);
Stream in 1e4 frames of the noisy input sinusoidal signal. The input noise is white Gaussian with a mean of 0 and a variance of 0.01. Since there are four filters, one input channel, and two paths between each input channel and output channel, the number of output channels of the system is given by . Pass the signal through the designed filter. Visualize the spectrum of the input and output signals in the spectrum analyzer.
for idx = 1:1e4
    x = sin_2100Hz() + sin_3kHz() + 0.01 * randn(frameLen, 1);
    y = simoFilt(x);
    specScope([x, y]);
end
Visualize the frequency response of sum of all the filter paths between each input channel and output channel by setting SumFilterPaths to true.
visualize(simoFilt,SumFilterPaths=true)

Input Arguments
Name-Value Arguments
Output Arguments
Version History
Introduced in R2024b