computeBoundaryModel
Obtain y-coordinates of lane boundaries given x-coordinates
Description
yWorld = computeBoundaryModel(
computes the y-axis world coordinates of lane boundary models at
the specified x-axis world coordinates.boundaries,xWorld)
If
boundariesis a single lane boundary model, thenyWorldis a vector of coordinates corresponding to the coordinates inxWorld.If
boundariesis an array of lane boundary models, thenyWorldis a matrix. Each row or column ofyWorldcorresponds to a lane boundary model computed at the x-coordinates in row or column vectorxWorld.
Examples
Create a parabolicLaneBoundary object to model a lane boundary. Compute the positions of the lane along a set of x-axis locations.
Specify the parabolic parameters and create a lane boundary model.
parabolicParams = [-0.005 0.15 0.55];
lb = parabolicLaneBoundary(parabolicParams);
Compute the y-axis locations for given x-axis locations within the range of a camera sensor mounted to the front of a vehicle.
xWorld = 3:30; % in meters
yWorld = computeBoundaryModel(lb,xWorld);
Plot the lane boundary points. To fit the coordinate system, flip the axis order and change the x-direction.
plot(yWorld,xWorld)
axis equal
set(gca,'XDir','reverse')

Create a 3-meter-wide lane.
lb = parabolicLaneBoundary([-0.001,0.01,1.5]);
rb = parabolicLaneBoundary([-0.001,0.01,-1.5]);
Compute the lane boundary model manually from 0 to 30 meters along the x-axis.
xWorld = (0:30)';
yLeft = computeBoundaryModel(lb,xWorld);
yRight = computeBoundaryModel(rb,xWorld);
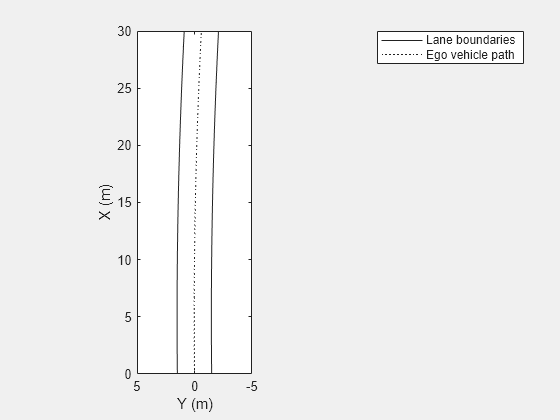
Create a bird's-eye plot and lane boundary plotter. Display the lane information on the bird's-eye plot.
bep = birdsEyePlot('XLimits',[0 30],'YLimits',[-5 5]);
lanePlotter = laneBoundaryPlotter(bep,'DisplayName','Lane boundaries');
plotLaneBoundary(lanePlotter,{[xWorld,yLeft],[xWorld,yRight]});

Create a path plotter. Create and display the path of an ego vehicle that travels through the center of the lane.
yCenter = (yLeft + yRight)/2;
egoPathPlotter = pathPlotter(bep,'DisplayName','Ego vehicle path');
plotPath(egoPathPlotter,{[xWorld,yCenter]});
Find candidate ego lane boundaries from an array of lane boundaries.
Create an array of cubic lane boundaries.
lbs = [cubicLaneBoundary([-0.0001, 0.0, 0.003,  1.6]), ...
       cubicLaneBoundary([-0.0001, 0.0, 0.003,  4.6]), ...
       cubicLaneBoundary([-0.0001, 0.0, 0.003, -1.6]), ...
       cubicLaneBoundary([-0.0001, 0.0, 0.003, -4.6])];
For each lane boundary, compute the y-axis location at which the x-coordinate is 0.
xWorld = 0; % meters
yWorld = computeBoundaryModel(lbs,0);
Use the computed locations to find the ego lane boundaries that best meet the criteria.
leftEgoBoundaryIndex = find(yWorld == min(yWorld(yWorld>0)));
rightEgoBoundaryIndex = find(yWorld == max(yWorld(yWorld<=0)));
leftEgoBoundary = lbs(leftEgoBoundaryIndex);
rightEgoBoundary = lbs(rightEgoBoundaryIndex);
Plot the boundaries using a bird's-eye plot and lane boundary plotter.
bep = birdsEyePlot('XLimits',[0 30],'YLimits',[-5 5]);
lbPlotter = laneBoundaryPlotter(bep,'DisplayName','Left-lane boundary','Color','r');
rbPlotter = laneBoundaryPlotter(bep,'DisplayName','Right-lane boundary','Color','g');
plotLaneBoundary(lbPlotter,leftEgoBoundary)
plotLaneBoundary(rbPlotter,rightEgoBoundary)

Input Arguments
Extended Capabilities
Version History
Introduced in R2017a