plotCoverageArea
Display sensor coverage area on bird's-eye plot
Description
plotCoverageArea(
displays the coverage area of an ego vehicle sensor on a bird's-eye plot. Specify
the position, range, orientation angle, and field of view of the sensor. The
coverage area plotter, caPlotter,position,range,orientation,fieldOfView)caPlotter, is associated with a birdsEyePlot object and configures
the display of sensor coverage areas.
Examples
Create a bird's-eye plot with an x-axis range from 0 to 90 meters and a y-axis range from –35 to 35 meters.
bep = birdsEyePlot('XLim',[0 90],'YLim',[-35 35]);

Create a coverage area plotter for the bird's-eye plot.
caPlotter = coverageAreaPlotter(bep,'DisplayName','Radar coverage area');
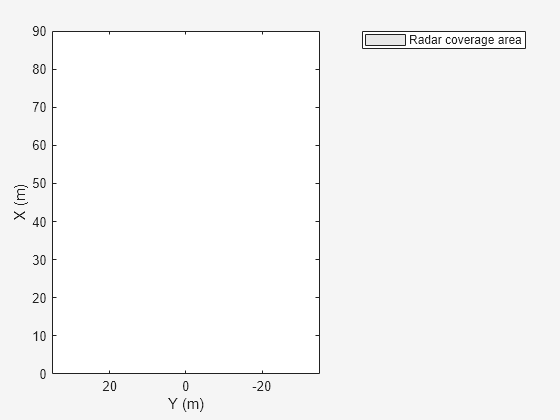
Display a coverage area that has a 35-degree field of view and a 60-meter range. Mount the coverage area sensor 1 meter in front of the origin. Set the orientation angle of the sensor to 0 degrees.
mountPosition = [1 0];
range = 60;
orientation = 0;
fieldOfView = 35;
Plot the coverage area.
plotCoverageArea(caPlotter,mountPosition,range,orientation,fieldOfView);

Create a bird's-eye plot with an x-axis range from –100 to 100 meters and a y-axis range from –100 to 100 meters
bep = birdsEyePlot('XLim',[-100 100],'YLim',[-100 100]);

Create coverage area plotters with unique display names and fill colors for each sensor location on the vehicle.
rearLeftPlotter = coverageAreaPlotter(bep,'DisplayName','Rear left','FaceColor','r');
rearRightPlotter = coverageAreaPlotter(bep,'DisplayName','Rear right','FaceColor','b');
frontLeftPlotter = coverageAreaPlotter(bep,'DisplayName','Front left','FaceColor','y');
frontRightPlotter = coverageAreaPlotter(bep,'DisplayName','Front right','FaceColor','g');

Set the positions, ranges, orientations, and fields of view for the sensors. The sensors have a maximum range of 90 meters and a field of view of 30 degrees. Plot the coverage areas.
plotCoverageArea(rearLeftPlotter,[0 0.9],90,120,30);
plotCoverageArea(rearRightPlotter,[0 -0.9],90,-120,30);
plotCoverageArea(frontLeftPlotter,[2.8 0.9],90,60,30);
plotCoverageArea(frontRightPlotter,[2.8 -0.9],90,-60,30);

Input Arguments
Coverage area plotter, specified as a CoverageAreaPlotter
object. This object is stored in the Plotters property
of a birdsEyePlot object and
configures the display of coverage areas in the bird's-eye plot. To create
this object, use the coverageAreaPlotter
function.
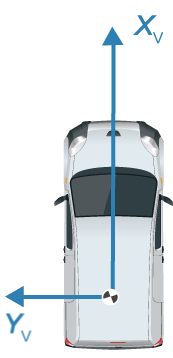
Position of the sensor in vehicle coordinates, specified as a real-valued vector of the form [XOriginOffset YOriginOffset]. Units are in meters.
XOriginOffset specifies the distance that the sensor is in front of the origin.
YOriginOffset specifies the distance that the sensor is to the left of the origin.
The origin is located at the center of the rear axle, as shown in this figure of the vehicle coordinate system.
Range of sensor, specified as a positive real scalar. Units are in meters.
Orientation angle of the sensor relative to the X-axis
of the ego vehicle, specified as a real scalar. Units are in degrees.
orientation is positive in the counterclockwise
direction (to the left).
Field of view of the sensor coverage area, specified as a positive real scalar. Units are in degrees.
Version History
Introduced in R2017a