view
Description
view( compares the original and fitted
models by showing the gap between the two models relative to the original model.R)
view(___,Parent= creates
a plot in the specified parent graphics container, such as a parent)Figure or
TiledChartLayout. Use this syntax when you want to create a plot in a
specified open figure or when creating apps in App Designer. You can specify
the parent container after any of the input argument combinations in the previous
syntaxes.
Examples
This example shows how to validate the quality of a fitted model when reducing model order using frequency response fitting method.
For this example, generate a random discrete-time state-space model with 30 states.
rng(3);
sys = rss(30);
Create the model order reduction object for frequency response fitting.
R = reducespec(sys,'frfit');Specify additional options. Such as, for the reduced model, the absolute error must not exceed 0.05 at each specified frequency point.
w = logspace(-2,2,50);
R.Options.Frequency = w;
R.Options.Feedthrough = 0;
R.Options.AbsTol = 0.05;
R.Options.RelTol = 0;
Run the model reduction algorithm and visualize the frequency response of the original model and the fit error.
R = process(R);
view(R);
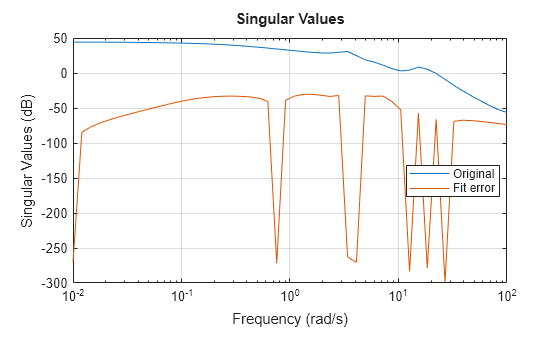
The error between the fitted and original models does not exceed the specified error of 0.05 (-26.02 dB).
Obtain the reduced model from the rational fit.
rsys = getrom(R);
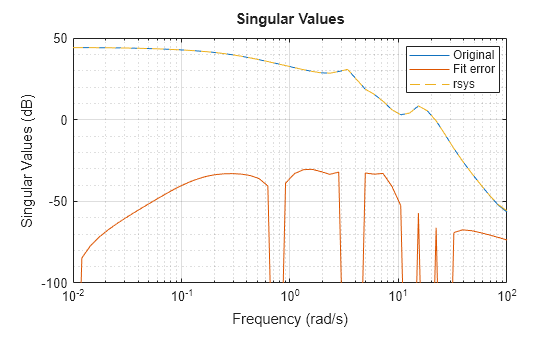
The view function can also return a SigmaPlot object. You can further customize this plot by modifying the properties of the object. For this example, enable the minor grid type and add the response of the reduced model on the same plot.
h = view(R);
h.AxesStyle.MinorGridVisible = "on";
h.YLimits = [-100 50];
addResponse(h,rsys,w,LineStyle="--");
Input Arguments
Output Arguments
Version History
Introduced in R2025a