Understanding Power Spectral Density and the Power Spectrum
Brian Douglas
Learn how to get meaningful information from a fast Fourier transform (FFT). There is a lot of confusion on how to scale an FFT in a way that provides an understanding of the properties of the time-domain signal, which is addressed in this tech talk. Specifically, it covers how to go from an FFT to amplitude, power, and power density and why you may choose one representation over another—and the scenarios in which they are valid.
Published: 12 Feb 2024
In this video, we’re going to look at how to get meaningful information from a Fast Fourier Transform, from an FFT. I want to clear up what I see is a lot of confusion on how to scale an FFT in a way that provides an understanding of the properties of the time-domain signal. Specifically, I want to cover how we go from an FFT to amplitude, power, and power density, and talk about why we may choose one representation over another and the scenarios in which they are valid. I think this will be useful so I hope you stick around for it. I’m Brian, and welcome to a MATLAB Tech Talk.
If you don’t know what an FFT is, then I’d recommend watching my video on it that I’ve linked to below. But for right now, all you really need to know is that when you take the FFT of a signal, it returns a vector of complex numbers. Here I’m just plotting the real and imaginary parts of an FFT for time signal Xn. And these numbers represent the phase and magnitude of the frequencies that exist within Xn. And we covered how in some cases, we aren’t concerned with phase, so we just look at the magnitude by taking the absolute value of the FFT. And then when dealing with real time signals, the magnitude of the FFT is duplicated between the positive and negative frequencies. And since the information is the same, we can choose to only look at the positive frequencies, a so-called one-sided FFT. And this is where we left that video, with a one sided plot of magnitude versus frequency.
Now, how can we use this information to understand something about the time signal. And when it comes to spectral analysis, the question you have have to start with is why are you doing it? What are you hoping to learn by analyzing a signal in the frequency domain? The reason this is an important question is because the tool you use to do your spectral analysis depends on your goal. And in the case of this video, how you manipulate this FFT depends on your goal.
For example, if all you want to know is where frequency content exists in the signal relative to each other, then this magnitude plot is sufficient. I can tell that there is a strong frequency component at 110 Hz here because of this peak, and a weaker, but still obvious component at 100 Hz. This level of analysis might be good for figuring out you know if there 60 Hz noise in a signal. Or maybe what the natural frequency is of a structure that is vibrating.
So, that’s pretty cool but the downside of this magnitude plot is that this value on this Y axis, you know the height of these peaks, isn’t a quantity that relates to some physical property of the time signal. So, what if you do want to know something quantitative about the signal? Say, the amplitude of a sine wave at a particular frequency.
Well, I’ll spoil it for you, this is how you do it. You take the absolute value of the FFT, then divide by N, the total number of samples in the signal. This produces amplitude but it’s split with half of the amplitude being captured in the positive frequencies and the other half in the negative frequencies. If we want a one-sided spectrum, we ignore the negative frequencies and double the values for every positive frequency except for the DC term, 0 Hz, and the Nyquist frequency (which by the way only exists if N is positive, if it’s negative then the Nyquist frequency isn’t sampled so we don’t have to worry about it). And that’s all we have to do.
And we can go over to MATLAB and see that this works it actually returns the amplitude of a sine wave. I have a time signal with two sine waves; with amplitudes 1 and 4. I take the absolute value of the FFT, divide by the number of samples, and then look at just one side and double it except for DC and Nyquist. And when I plot this spectrum, the Y-axis now shows amplitude, 1 and 4. Perfect!
So, why divide by N? Why does this work? Well, let’s quickly walk through an explanation. And I not going to be mathematically rigorous in this explanation but hopefully you understand the general idea of how the FFT can produce amplitude.
Ok, the FFT is mathematically equivalent to the discrete Fourier transform, which says that we start with a time signal, Xn, multiply it by a correlating single, this exponential, and then sum over all of the samples. This produces the frequency domain coefficient, Xk. Also, E raised to an imaginary number is equal to cosine plus i sine.
Alright, let’s say that the time signal is just a sine wave with amplitude A. It doesn’t matter what frequency it’s at so I’m just putting a dot in here. If we plug this into the DFT, we get that Xk is equal to amplitude A times the summation over all samples of sine times cosine minus i times sine squared.
Sine times cosine produces another sinusoid and the summation over one period is zero. So, no matter how long the signal is, the summation will always be close to zero, therefore, this component doesn’t contribute much to the summation.
Sine squared on the other hand, looks like this, like a sinusoid at that goes between zero and 1. And since this is discrete, we’re sampling it N times. Now, the more samples we have the larger this summation will be. However, if we add up the samples and divide by the number of samples this gives us the average height of this sine squared function, right? If you add up 10 numbers and divide by 10, you get the average value. Well, the average value for sine squared is 1/2.
So, if we go back to the above equation, we can divide Xk by N. Then this whole summation is 0 for the first component still, but 1/2 i for the second, since it’s just the average height of sine squared. Now we’re taking the absolute value of Xk which gives us the magnitude of the FFT, and that is equal to half the amplitude.
And again the reason it’s half, is because the amplitude is split between the positive and negative frequencies. But if we’re just looking at a one-sided FFT, then we you know we’re multiplying this by 2, and we’re left with amplitude. Now, if our original time signal had a phase shift to it, this all still works out mathematically, I just did a zero phase sinusoid to make it easier to follow. But I think overall this is pretty cool. That we can find the amplitude of a sinusoid simply by taking the FFT and scaling it.
Alright, so that’s amplitude, but what if we want to know power at a particular frequency? The average power of a sinusoid is just its amplitude squared over 2. And since we know that the absolute value of the FFT divided by N gives us the amplitude over 2, then the easiest thing we can do is just square that value. This is the two-sided power spectrum since the power is split between negative and positive frequencies. To get the one-sided power spectrum we multiply it by two. So, this is how we go from the FFT to the one-sided power spectrum.
Let’s go back over to MATLAB and see how we can implement this. This is the same script as before so we’re working with the same 2 sine wave signal. I’ll scroll down past amplitude and to the power section.
Here I’m taking the absolute value of the FFT, squaring it, and divide by N^2. And then to get a one-sided power spectrum, we ignore the negative frequencies, and double the positive frequencies. Again, except for DC and Nyquist.
The plot looks like this, with powers of 1/2 and 8 which correspond to amplitudes 1 and 4 respectively. Now often, we like to look at power in decibels, so let me do that here with the pow2db function, and re-run this script. This one sided power spectrum that I created took several lines of code. And you can type this all out each time you need the power spectrum, however, we can get the exact same result with the periodogram function. There are many different ways to create a periodogram, but here I’m running it with a rectangular window, an FFT the length of the entire signal, and setting it to return the power spectrum, instead of power density. These are the parameters that exactly copy what we just coded above and you’ll have to take my word for it, but these two plots are identical.
So, there we go right, to get one-sided amplitude we take 2 times the absolute value of the FFT and divide by N, and to get power we take 2 times the absolute value of the FFT squared, divided by N^2. Easy right?
Well, kind of. We have to be careful here because these results are only true if there are three very important things. One is that we’re using a rectangular window and not some other window like Hamming or Blackman, two, the time signal is stationary. And three, we’re dealing with time signals that produce discrete frequency power spectra, not a continuous spectrum.
Let me go through each of these and explain why they are important for these equations to hold.
We’ll start with the rectangular window. When we take the FFT of a time signal, it necessarily must be finite. There is a start time and an end time. Therefore, we’re only looking at a small subset of the total possible infinite signal and from this subset, we’re trying to understand the signal properties. This subset of data is called a window since we’re only looking at a portion and the rest of obscured from view.
Now the window could be longer or shorter, or we could look at a different part of the signal, but no matter what, we’re always just looking at a subset. Now what I have drawn here is a rectangular window. That means that each sample in the window is unmodified. That is, we multiply everything inside the window by 1 and 0 outside of the window. This makes sense, right? I mean why would you want to change your signal if you’re trying to find out properties of that signal?
Well, one reason is for spectral leakage. One way spectral leakage occurs is when the period of a time signal frequency is not an integer multiple of the window length. In these cases, cutting a period short like this spreads that signals energy out into neighboring frequency bins since that summation we talked about earlier doesn’t get fully canceled out by having a complete period. And one way to mitigate this is to use a longer time series because that left over period gets averaged across a longer time span, but if that isn’t possible - then another way is to apply a non-rectangular window to your data. Something like a Hamming window that attenuates the signal near the edges and reduces the effect of that partial period. This reduces the spectral leakage but it also comes at a cost of lower resolution. Now, I’m not going to cover different windows much in this video, I just want you to be aware that you might not always be dealing with a rectangular window.
And as you might expect, if you attenuate the signal near the edges, you are of course affecting the average amplitude and the average power within that window. Therefore, the equations we derived for amplitude and power are only valid for rectangular windows. There are ways to account for the effects of the window when looking at power, which I’m not going to cover in this video, but if we go back to MATLAB and the periodogram function, we can see that it does handle the effects of the window. Both Hamming and rectangular windows produce the correct power for the 110 Hz frequency that I’m showing here.
Alright, for the second requirement, the time series must be stationary. This just means that the signal, from a statistical standpoint, doesn’t change over time. The mean and the variance of the signal are the same regardless of where you look. Now there could be stochastic variances from noise and other things, but the core properties of the signal that you’re trying to analyze doesn’t change.
And here’s a way to understand why it’s a requirement. Remember back when we were deriving the amplitude, we divided by N because we were looking for an average amplitude. And we sort of had an assumption that the amplitude is relatively constant across the window, right? I mean, take for example this signal. It’s a single frequency, but the power is changing throughout the window. If we calculate the power for this frequency it will give us an average across the window but won’t provide any indication that the power is changing. A worse case scenario of this is if there is a very short term high power event that is just averaged across a longer window potentially causing it to be lost in the noise.
Alright, we know that we want a rectangular window, and we want the signal within that window to be stationary. Now for the third requirement, we need the signal to have discrete spectra. That means, that it is made up of discrete sinusoids. Why this is required is really important.
To explain why, let’s go back over to MATLAB. Here, I have a time signal with two sine waves - one at 100 Hz and one at 110 Hz. I’m taking the FFT and then scaling it for the power spectrum. Now what I’m plotting here is the true power for the two sine waves - that’s the red and yellow stems, and the power spectrum for the signal, which is the blue curve. Notice how these peaks for the blue curve aren’t perfectly sharp but are spread out a bit. This comes from spectral leakage that occurs because we’re using a finite window. But the important thing is that the peak of the power spectrum is at 8. So we’re getting an accurate measurement of power at these frequencies.
Let me hide the code now so we can focus on this graph. Watch as I move the frequency of the second sine wave closer to the other. At some point their spectra start to interfere with each other. And then when they’re too close, they merge into a single peak.
Now, the value of the Y axis isn’t reporting an accurate power at that frequency. In fact, we can’t say much of anything about the power of each individual sinusoid. What’s being reported is some combination of the two frequencies that are just too close to each other to separate out.
This is just two discrete sine waves, but imagine in the case of broadband signals where the frequency spectrum is continuous. In this plot, I’m showing 50 sinusoids between 100 and 100.5 Hz. And each of them contribute a very small amount of power. But if I zoom out, we can see that the power spectrum for the time signal is much higher because they all contribute to the total.
So, hopefully you can see that this peak doesn’t represent a power at a particular frequency, but the power of all of the frequencies that contribute to it. So, in some way it represents power density. This area is much more dense than these areas are. And we can tell that from the peak. And we can normalize this plot by dividing it by some frequency bandwidth - specifically the equivalent noise bandwidth which is in some way the width of frequencies that contribute to a particular sample in the power spectrum and it is a function of the window.
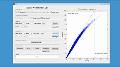
A finite length widow will necessarily blend the power of nearby frequencies together like we saw. We can see how this blending occurs by looking at the power spectrum of the window itself. For a rectangular window of length 128, sampled at 1000 Hz, this is its power spectrum. I’ve shifted the negative frequencies to be on the left so that we get a better sense of this curve.
Notice that the window has maximum power of 1 right at 0 Hz. So, the way we can interpret this is that this window will pass through the power for the frequency that is being sampled unmodified. It’s multiplying it by one, so, we can accurately get the power from a single sine wave. However, along with that value, this window will also add in the power at all of these other delta frequencies attenuated by the amount given by the curve.
The longer the window, the steeper this curve. Which means that a longer window will have fewer contributions from nearby frequencies than a shorter window does.
Alright, each sample in the spectrum is the summation of the attenuated power from all of these nearby frequencies. So, we might think that the bandwidth we’re interested in is however far out this tail goes, since all of those frequencies are included. But, as we can see, these far away ones don’t contribute much. So we really only want to consider the frequencies that have the most impact.
The way we find that is to approximate this curve using a rectangle with height equal to the peak and whose area is equal to the total power. So the area under the blue curve is equal to the area under the red rectangle. And the width of this rectangle is the equivalent noise bandwidth. Under this assumption, we can say that this is the range of frequencies that contribute to each sample in the spectrum.
And so to get power spectral density, we divide the power spectrum by the equivalent noise bandwidth. We know power spectrum is the absolute value of the FFT squared divided by N^2. And this is the equation for the equivalent noise bandwidth for an arbitrary window. I’ll leave a link below to a derivation for it below the way we read this is that we square each of the terms in the window and them sum then all up and the multiply that by the sample rate and divide by the sum of the window terms which is then squared. For a rectangular window each of the N terms have a value of 1, and so this becomes, fs *N over N^2, or fs divided by N.
Now when we divide the power spectrum by this, the N’s cancel out, and we’re left with 1 over fs*N times the absolute value of the FFT squared. This is the scaling for power spectral density using a rectangular window.
And for the last time in this video, let’s go back to the MATLAB script and see it in action. You know what’s going on at this point, we’re just taking the absolute value of the FFT, squaring it and dividing by fs *N. And voila, the power spectral density.
And instead of typing all of this out, we can use the periodogram function to generate the PSD. And the nice thing about this function, is that it’s really easy to change the output to power or to change the window and see the result quickly.
Now, if you want to play around with this script I’ve left a link to it below.
But, I hope this has cleared up some confusion about the FFT and power. The thing to remember is that if your signal is made up of a few dominant sine waves then you can look at the power spectrum to get the power in those frequencies. However, if there are broadband signals, then it probably makes more sense to look at the PSD instead since that returns the power per frequency band. Mathematically, you can take the PSD of a single sine wave, or the power spectrum of wide band signals and get a plot, the trouble comes when you try to tie those plots back to some physical properties in the time domain because they won’t make much sense. This is why you have to know what you’re trying to accomplish and what kind of signal you’re looking at in order to choose the correct tool. Alright that’s where I’m going to leave this video.
Don’t forget to subscribe to this channel so you don’t miss future videos. Also you can find all of the Tech Talk videos, across many different topics, nicely organized at mathworks.com. And if you liked this video then you might be interested to learn about the Fast Fourier Transform in our video on the FFT and the DFT. Alright, thanks for watching, and I’ll see you next time.
Download Code and Files
Related Products
Learn More
Featured Product