Sustainable Finance with MATLAB - MATLAB
Video length is 22:11

Sustainable Finance with MATLAB

Thierry Roncalli, Amundi

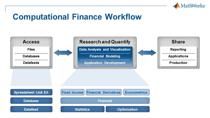
Join Thierry Roncalli, head of quantitative research at Amundi, as he explores the practical applications of MATLAB® in teaching sustainable finance. This presentation covers key topics like carbon taxes, portfolio decarbonization, and stress testing. Thierry will also highlight exciting results from his recent research and provide a sneak peek into his forthcoming book, Handbook of Sustainable Finance (March 2025).

Published: 22 Oct 2024

Today, I am going to talk about sustainable finance with MATLAB. I will not really present the empirical results of a specific research paper. This is not the purpose of my presentation. The goal is to show you how we can use MATLAB to learn and develop models in sustainable finance. So, a typical example is how to implement portfolio decarbonization in MATLAB or how to implement a climate stress-testing program with input-output analysis in MATLAB.

My presentation is based on the Handbook of Sustainable Finance that I started writing two years ago for my student at the University of Paris-Saclay. So this handbook is free. It has more than 1,000 pages.

Moreover, the LaTeX files, all the PDF files-- so, the MATLAB grapher-- and all the MATLAB codes are also freely available. So to give you an idea, there are more than 1,000 M files. So you can download all these materials from the homepage of the Handbook of Sustainable Finance.

So just to remark about the organization of the MATLAB Toolbox and the MATLAB programs in the Handbook of Sustainable Finance, programs of Chapter X are located in a unique directory, generally named X. So for instance, all the program use in Chapter 11, called "Climate Portfolio Constructio," are in the Directory 11, Portfolio Optimization.

So how to find the MATLAB program for a given figure or a given example or a given table. So I have adopted the convention of giving the MATLAB program the same name as the LaTeX element, example, exercise table or figure.

For instance, here is an extract from page 750 of the Handbook of Sustainable Finance. So this is a section dedicated to the calculation of carbon budget.

So here is a LaTeX code of the handbook. So the LaTeX code of the Example 36. And you have access to it because it is free and you can download the LaTeX code.

So we see that the label of the Example 36 is chap9-carbon-budget1. So we deduce a corresponding MATLAB file is chap9-carbon-budget1.m.

So if we run this M file, we see that it generates the figure of the example that you can find in the Handbook of Sustainable Finance, on page 750.

So before I present some application, you may ask why using MATLAB. I use MATLAB both in my academic position and in my professional position. And for me, there are three main factors-- first, MATLAB syntax; second, visualization capabilities; and third, computational power.

So here is a slide from my course, a course I give at the University of Paris-Saclay on portfolio optimization. So this is a classical Lasso regression, which is a linear regression with an L1 penalization. And the most efficient way to solve this optimization problem is to use the CCD algorithm, or the Cyclical Coordinate Descent algorithm.

So I have reported in the green box the CCD solution, and also the corresponding MATLAB code here. And we note that we can easily translate the mathematical solution into a MATLAB code. And moreover, what is very important, using the MATLAB code, students can then better understand how the CCD algorithm works.

So let us consider an example with biodiversity risk. On this slide, I have shown a classic model that describe the evolution of species richness when the habitat area is reduced in case of habitat losses. So the idea is to illustrate the concept of extinction depth-- that is the fact that extinction can occur long time after the habitat loss.

So we can easily translate this mathematical model into MATLAB code. Moreover, we can also use very similar notation. So this help students to really understand the mathematical model and the different step to use it.

Here, I have marked in red the two lines of MATLAB code that correspond to the two previous equation. So this red line correspond to this equation. This red line correspond to this equation. And then we use the Audio solver of MATLAB in order to find the solution.

And if we run this program, we get this graph that we can find on page 391 of the Handbook of Sustainable Finance. So in this case, we see that if we reduce the habitat by 50% in this example, it will take 500 years or five centuries to reach the new equilibrium.

Another important feature of MATLAB is that we can draw very complex graph easily. On this slide, I compare the radiation spectra of sunlight with Earth's surface. We can think that it is not easy to draw the visible spectra with all these colors. In fact, it is.

Here is the MATLAB code that I have used to generate the radiation spectra. We just need the right color map here. This is a colormap turbo. And calculate the intensity of the blackbody radiation using the Planck formula, the Planck law, the Planck distribution, and a few lines, and the job is done.

Another important aspect for me is the possibility to use LaTeX formulas in the MATLAB figures, because I use a lot of mathematical symbols, a lot of mathematical equations. Here are two examples where I use LaTeX symbols.

The first graph, on the left, shows the evolution of the gas concentration of Vostok ice cores to calculate the historical temperature in the past. In particular, the y label of the last panel, the third panel, is a oxygen isotope expressed in parts per thousand. So the unit is not 1% but 0.1% So it is not easy to find the symbol and to find languages that offer so much flexibility to include LaTeX packages here, the parts per thousand symbol.

So the second graph is a graph to illustrate the issue of tipping points in climate change. Again, I am very happy to mix MATLAB and LaTeX so easily.

The third important factor is computational power. In climate risk modeling, we sometimes manipulate huge databases, such as the IPCC database, the NGFS database, or physical risk databases. A standard approach to doing a climate risk assessment of a carbon tax on corporates and also on countries is an input-output analysis.

The problem is that we have to mathematically manipulate a matrix called A, which is a matrix of technical coefficient. And the dimension of this matrix is nm times nm, where n is the number of sectors and m is the number of regions.

Of course, perhaps you know WIOD and Exiobase. But WIOD and Exiobase are the two well-known input-output database used by policy makers and academics and professionals.

In the case of WIOD, the size of the matrix A is 46 megabytes, while in the case of Exiobase it is equal to about 400 megabytes. So now we need to compute its eigen decomposition, its singular value decomposition, its matrix inverse. We have to manipulate the data. We have to calculate, for instance, its matrix power and so on.

So we really need a language that is not limited to linear algebra, for larger, large, huge matrices. I really appreciate MATLAB for that because that I will not be limited. And for illustration, here on the left, you have the sparsity plot of the matrix A of WIOD, and on the right you have the Frobenius norm of the matrix power A k in the case of the WIOD database.

Let us now see some illustration about ESG investing. First question, how do we assess the persistence of an ESG rating system? We want to have a stable system, but at the same time, we want the system to be reactive. So the classic approach to measure the persistence of an ESG rating system is to calculate the ESG migration matrix or the probability transition matrix.

So here, this is an example, the one-year transition probability matrix, one-year transition probability for a given ESG rating system. And the persistence for time t is equal to the trace of the matrix, exponential of t times lambda divided by the number of states, where lambda is the Markov generator associated with the transition matrix. So we interpret lambda T as measuring the average probability that states will remain in their states at time t.

So in the graph on the right I have compare two ESG rating systems and one credit rating system, ESG rating system are generally less persistent than credit rating system. In general, we define the lifetime or the time of the system, the lifetime, as the value of t such that the probability is 50%

And in this example, the credit rating system has a lifetime of five years, the first ESG rating system has a lifetime of 3.4 years, and the second ESG rating system has a lifetime of 1.4 years.

So here is a MATLAB code to compute the Markov generator and to draw the previous figure. What do you see? You see that it is based on the matrix logarithm implementation in MATLAB, logm.

There are several ways to consider portfolio optimization with sustainable preferences. In general, three approaches are considered. The first approach was developed by Pastor, et al. The second is a model of Pederson. And the last one is a Markowitz optimization framework with sustainability constraints.

So the Pederson model is a bit tricky because it has a three-stage embedded optimization. However, it can be solved using numerical optimization and the quad function of MATLAB.

So let us consider an example with four assets. Here we can find the solution using the MATLAB function. And so we can use the compute_pederson_portfolio function, which solves the three-step embedded portfolio, or we can iteratively use the MATLAB function compute_mvo_portfolio, which solves the classical Markowitz problem.

Two other illustration which are very classic. On the left, this is the impact of a minimum ESG score on the mean variance efficient frontier, while on the right, this is the impact of an ESG strategy-- for instance, the difference between an integration strategy, a selection strategy, or an exclusion strategy. So this is the impact of an ESG strategy on the tracking error efficient frontier.

So the two figures are generated with the program chap16-chap3-exercise1.m. So the first figure is based on the MATLAB function to solve the classical Markowitz optimization problem, while the second figure is based on the MATLAB function where the portfolio variance is replaced by the tracking-error variance, and the expected return of the portfolio is replaced by the excess return over a benchmark.

Let us now turn. The assessment of a carbon tax. To analyze a carbon tax, economists and policy makers typically use input-output analysis. For those who are not familiar with this tool, The input-output model is also called the Leontief model, and it is a description of the interdependencies between different sectors of an economy. So it is based on the identity supply equal demands. And we can show that the output vector of an economy x is equal to the inverse of the identity matrix minus the matrix A of technical coefficient times the final demand vector y. So the matrix A is very important because it summarizes the supply chain dependencies between sector and between countries, both the upstream supply chain and the downstream supply chain.

So this model is extensively used to calculate the carbon footprint of a sector or a country, not from the viewpoint of the production, but from the viewpoint of the consumption. So for instance, the values of exported and imported carbon emissions published by the OECD, the World Bank, and other international bodies are calculated using an input-output analysis. And we can show that we can calculate the indirect emission due to the upstream of the supply chain with the matrix of technical coefficient and the scope 1 emission. I have reported here some classic formulas for calculating indirect carbon emission from the supply chain.

So let us consider an example with a basic economy. And using the previous formulas, we can calculate the total direct and indirect emission for all the sectors, the four sectors. And we can also break down the indirect emissions because of the Neumann series. We can break down the table below.

We can break down the indirect emission along the supply chain, and the different tiers or level of the supply chain. So you can have the tier 1, the tier 2, the tier 3 impact of the supply chain on the indirect carbon emission.

And here is a MATLAB code used to generate the results. So here is a comparison of the total carbon intensity of the MSCI World Index by sector calculated using three different databases. One database is Trucost. Why I use WIOD and Exiobase to calculate the matrix A of technical coefficient. And compute the total carbon intensity using the previous formula.

So it is interesting to see that the results are consistent between the three databases except for the energy sector where the calculation with Exiobase gives a higher result.

To examine, to understand the impact of a carbon tax in an economy, we need to understand how the carbon tax is cascaded along the supply chain along the downstream of the supply chain. In fact, the producer has a choice to pay the carbon tax or to pass on a part of the carbon tax to its downstream or to the consumers. And for that, we need to incorporate the pass-through mechanism into the cost-push price model. So we get these formulas.

And using our previous example-- so the basic economy-- we can test the impact of a carbon tax of $100 per ton of CO2 if the pass-through rate-- so the graph on the left is the pass-through rate-- is equal to 0, the cost to the producer is equal to $100. Sorry, $150. If the pass-through rate is equal to 100%, the cost to producer is 0, and the cost to the downstream supply chain is more than $400. So we note the amplification of the cost of the carbon tax because of the pass-through mechanism of the supply chain.

So here I have calculated the cost of a carbon tax of $100 per ton of CO2 equivalent. Of course, the carbon tax generates revenue for the government, so it is estimated to 2.82% of the world GDP. But it also impose costs on the economy. It is estimated at 5.01% for the world economy.

So we also know that only 20% of these costs are paid by the producer, while 80% are borne by the downstream supply chains. So we also note that some countries will suffer more than others.

If we consider a carbon tax for the European Union, we have calculated that 95% of the cost will fall on European countries. So this implies some distortion of competition between Europe and the rest of the world.

We can also measure the impact on the inflation. So here are the results for the PPI-- the Producer Price Index. Of course, a carbon tax has an inflationary effect estimated at 4.08% at the global level. In the case of a European carbon tax, Bulgaria and Poland are the most affected countries.

When inflation is measured by the CPI-- the Consumer Price Index-- so the results are somewhat different. In particular, we see that the ranking of the countries is different. This is due to the supply chain of each country and the dependence of its supply chain on the supply chains of the other countries. So in the case of the PPI, the upstream supply chain is a key variable, while in the case of the CPI, the downstream supply chain is a key variable.

And finally, a last illustration on portfolio decarbonization and net-zero investing. I have reported here the typical portfolio optimization problem when we want to implement decarbonization for equity and bond portfolios. One important point. In the case of bonds, we need to use an active-risk measure, which is an L1 risk measure, and not an L2 risk measure.

So the program for equity portfolios is a quadratic programming problem. In this case, we need to use a quadprog function of MATLAB. The program for bond portfolio is not a quadratic programming problem, but it is a linear programming problem. So in this case, we need to use a linprog function of MATLAB.

So here are some results for the MSCI World Index. The tracking error is, of course, an increasing function of the decarbonization rate R. But what is interesting is that the tracking error is higher when using scope 3 emissions than when using only scope 1 and 2 emissions.

So here are the impact on sector allocation. Implementing a decarbonization strategy implies to be long on financial and short on energy, materials, and utilities. For bonds, we obtain similar results.

Net-zero investing are more complicated to implement. The optimization problem is more complex because it needs managing. We have to manage both the carbon footprint and the green footprint of the portfolio, as well as the trajectory of the decarbonization pathway, not just a picture at time T.

So in green, I have shown the additional cost of tracking R when we move from decarbonization-- decarbonization correspond to the blue line-- to net zero. This correspond to the green dashed line.

So for example, we see a huge gap when we look at scope 1 and 2 in terms of tracking our risk. This is less the case when we look at scope 3 emission. And I think that I have other slide, but I will stop here because it's time to give the floor to the chat.

View more related videos