Navigating Climate Finance: Software Solutions for Climate Risk Management
Elre Oldewage, MathWorks
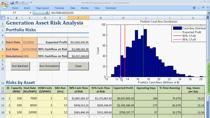
In the evolving landscape of climate finance, the need to incorporate climate impacts into risk management strategies presents significant challenges and opportunities. This presentation leverages empirical data and real-world experiences to explore the intricacies of managing climate-related financial risks through software applications. Explore workflows around geolocating physical assets, hazard identification, financial impact estimation, and the integration of climate risk into operational frameworks. By examining case studies, this talk demonstrates the pivotal role of software solutions in transparent, scalable, and reproduceable climate risk management.
Published: 22 Oct 2024
Climate risk is becoming an increasingly germane topic for many of our customers, and I probably don't need to say very much to convince you of that. The summer of 2024 was the hottest on record for Europe and globally. Around 2 million people across Central Europe were affected by severe flooding in September alone. And the US is still reeling from the back to back hurricanes Helene and Milton, for which almost half of the direct economic damages are due to human-caused climate change, according to a rapid-impact attribution study by Imperial College, London.
And so on the back of this increasing climate risk, we have been hearing from more and more customers that they need a solution for assessing their climate risk. And so today we're going to present some case studies of how we are working with firms to help them assess their exposure to the physical risks from climate change.
Now, I should note here that we're also doing some work on the transition risk side, but that's beyond the scope of a 20-minute presentation. But if you are interested in that, please do reach out to us. We'd love to talk to you about your use case.
So we're going to start by talking about what makes a good climate-risk solution. And this is all grounded on what we hear from our customers who are engaging with us to help develop their climate risk solutions. And then we're going to look at two case studies, one on flood risk and one on tropical cyclones. And then we're going to show how we can practically realize these requirements that we introduced at the start.
So what makes a good climate risk solution? And the first thing that we're hearing from industry is that they need greater transparency from their vendors. Customers don't want black box answers. They're hard to explain both to investors and to other stakeholders.
And there are many data vendors available here. They can tell you about your risk scores for flooding or for wildfire or for hurricanes. And they're all wonderful.
You log in. You tell them where your assets are located, and they give you a number. They give you a number like 4 out of 5 for your hurricane risk score. And you can go away and you can think, ah, 4 out of 5. That is meaningful. That's quite a lot.
But then you log on to another data provider, and they tell you your hurricane risk is also 4, but their scale goes out of 10 or maybe out of 8. And it can be really hard to reconcile how these different data vendors can give you such different answers. Clearly, they're using some different kinds of underlying data, but they are often not willing or unable to provide you more details about what underlying assumptions and data sources they're making.
So our customers tend to be the kind who are happy to roll up their sleeves and get your hands dirty with some of the modeling in a way that you can tweak some things and understand how the modeling works, and how all of these different factors work together to bring about this mysterious climate score of 4.
And this kind of ties into my next point, which is customizability. So sometimes you don't need to make underlying assumptions. Sometimes you actually know the answers. So your data vendor might, for example, assume that all the buildings in a particular city are made of concrete, and make assumptions about the corresponding damage as a result of that. But you might actually know what your buildings are made out of, and you don't need to make that assumption. You could have very specific, fine-tuned answers to your questions if you were able to customize your solution.
And these solutions are also not one size fits all. Different perils are relevant for different locations. And you don't want to pay a princely sum of money for hurricane risk assessments if you're in a landlocked country in Central Europe.
And our final point is around scalability. So this is in terms of two different factors. The first is in terms of modeling factors. So, how many years are you projecting into the future. How many assets do you have. How many different climate scenarios are you considering.
But also in terms of the business side. You want a climate-risk assessment that is repeatable, not a once-off thing. You can't have your risk assessment be distributed across Excel spreadsheets and CSVs on different people's computers with names like Risk Assessment 1, Risk Assessment 5, Risk Assessment Final Final Final. That's not repeatable. And eventually, as new research and new models become available, or your portfolio changes, you might need to be able to modify and rerun those assessments in a way that is reliable.
And so we're going to discuss two case studies to show how we can do this kind of thing. So for each one, we are going to hone in to our transparency, customizability, and scalability requirements. And while I'm unable to mention which customers these use cases are based on, they are based on actual consulting projects for MathWorks customers.
And we're going to start with flooding risk. So this particular project was done for a leading mortgage insurance provider in France. And in this case, we're going to look at the flood risk on their mortgage portfolio.
But I should say here already that this kind of risk assessment is really relevant for any geo-localized asset. So anything for which you have a latitude and longitude. That could be properties in a mortgage portfolio. It could be the location of your suppliers if you're doing supply-chain risk assessment. And so on.
So we're going to start our analyses using this risk triangle. And this is something that you might have seen before if you come from the natural catastrophe world. The idea is that there are these three components. We have exposure, which is the information about your assets; the hazard data, which is about the peril that we're considering; your vulnerability, which maps the intensity of the hazard, basically, to how much it's going to cost you in money. And these three things together form your risk.
So in the context of flooding, our exposure is going to be information about our assets, like the property address, the property value, how much is still outstanding on the loan, and so on. Our hazard data is going to be information like the flood depth, the likelihood of it flooding. And then we list some example sources that you could use over there-- for example, JBA flooding, ISIMIP, and so on.
And then, finally, we come to the vulnerability component. So this is essentially something called a damage function, and that maps the intensity of the hazard in combination with the information we have about your assets, to the financial impact that the peril will have.
And combining all of this information, we can get to metrics that we care about. So, for example, projecting the cumulative property damages or the loss given default under different transition scenarios, or a risk-adjusted loss given default.
So let's start with the exposure data. In this case, we have a portfolio of property information which might be lying somewhere in a database or an Excel spreadsheet. And using our tools, it's relatively easy to reconcile this into one location. So, even if it's in a variety of formats or distributed across different locations.
But there are some challenges here. So how do we map these addresses to points that are latitudes and longitudes? Typically, there are API services that you can use. The degree to which they're accurate varies a bit on the location that you're considering. And you might actually have to try a number of different services to arrive at one that gives you something sensible.
And then you have issues with potentially having different graphic coordinate systems that you have to be able to convert between, problems with incomplete and incorrect data, and so on. And fortunately, our tools makes it quite easy to handle all of this. You can do these kinds of conversions. You can deal with missing data and auto-filling data without spending or wasting a lot of time on that sort of problems.
So that's one part of the puzzle. That was the exposure data. But we're also going to need some information about our hazard, about the flooding. So, specifically, we're going to need flood-depth projections.
And here we decided to use data published by the Inter-Sectoral Impact Model Intercomparison Project, which is called ISIMIP. I always mess up that acronym. But they're on the slides if I said it wrong.
So ISIMIP projects the impact of climate change following different what's called Representative Concentration Pathways, or RCPs. And they essentially describe different climate futures, ranging from very high greenhouse gas emissions, which is RCP 8 and 1/2, to scenarios where the emissions are significantly lower, which is around RCP 2.6. There's the middle of the road scenario, which is RCP 4.5. And we'll call these different scenarios, no action, early action, and late action.
And how these flood projections work is kind of in two steps. On the left, you can see the general hydrological model, and that's this very big model that models things like evaporation, runoff. You can see the whole big water cycle. And then it's got outputs that we then feed into smaller, more specific models like the one on the right, which is the CaMa flood model, which only considers river flooding.
And how this works is the Earth's surface is divided into these cells, they're called, of about 3 to 4 square kilometers. And then you can model the flood depth within that cell, and also the probability of a particular cell flooding, or the fraction of the cell flooding, which we loosely interpret as a probability.
So that takes care of our exposure and hazard data. Next up is the vulnerability component. So in other words, how does the intensity of the hazard translate to the damage of my assets. And in this case, we're going to map the water height, if the property floods, to property damages, which are expressed here as a percentage of the property value that is lost when it floods. And you can see an example of one of those on the left there for the US, Europe, and Asia.
So damage functions for flooding are actually a pretty well-established area of research, and there are published damage functions that you can choose from literature. So you choose one that's relevant to your specific geography and to the types of assets that you're interested in. So for example, here, this is for residential properties, but you get slightly different ones for commercial, industrial, agriculture, and so on.
So the ones that we used here were based on the technical report by the European Commission's Joint Research Centre. And yeah, the dynamic in general is quite easy to understand. The higher the water, the more damage is done to your property.
And then we can tie all of this together to assess the financial impact on our mortgage portfolio. So here you can see we have the damage, which is a function of-- and there we have the little damage function. The damage, which is the function of the height of the water. And there you can see a little sample of flood heights for the region. And we're going to multiply that by the fraction of the flooded cell, which we said we're going to use roughly as a probability of your property getting flooded if you're in that cell. And then you multiply that by the value of your property. And all of that together gives you the damage that you can expect to incur.
And we can use that to do something like compute the cumulative property damages for the whole portfolio for each of the different transition scenarios. So you can see that the early-action and late-action scenarios don't show much difference, although the no-action scenario clearly incurs higher cumulative damages.
And here we are making some assumptions. For example, we're assuming that the damages accumulate. So we're essentially plotting the financial stress that the homeowner would incur if they had to fix the property every year after the flood. But you could make different assumptions here. You could use a parametric function that links the percentage increase in precipitation to damage loss, for example.
We could also compute the LTV for the portfolio as a whole, which gives us a plot like this. And here you can see that the baseline scenario, which doesn't consider any climate-related damages, is lower than all the climate scenarios. And if you really zoom in there-- it's not very obvious from this plot-- but the no-action scenario is a little bit higher than all the others.
And you can then go on to feed these results into later models. For example, if you have a credit model that includes the LTV ratio as a predictor, then you can compute the adjusted probability of default by inputting the new LTV ratio. Here, for example, we're using a lifetime probability of default model that includes the LTV ratio and the age of the mortgage as predictors.
So let's tie that back into our three requirements of transparency, customizability, and scalability. So on the transparency side, we used publicly available peer-reviewed climate models, so anyone can see how these models work. You can read the accompanying publications for these models. So there's no additional magic happening under the hood. There's nothing that you couldn't find out if you were a climate scientist or if you were very interested. And where our customers choose to use private data vendors, we can often liaise with these vendors to get validation information where applicable.
We also have clear modeling assumptions of the damages. There's accompanying publications for the damage function we choose to use. They lay out the assumptions that they make about, for example, how much of the building can't be damaged, how they split into regions, and so on.
And we can understand every component in our damages equation here. It's very simple. We multiply them all together. There's no magic that's happening under the hood.
On the customizability side, we might want to have some slightly different modeling assumptions-- for example, within our damage function. And we're going to talk a little bit about how you could customize that within this framework.
You might also want to incorporate additional informative data where you have it. So if you do know of a data vendor whose risk scores you trust, then you can use that to calibrate your damage equation, as I'll show you. And then we'll go on to talk a little bit more about this from the tropical cyclones perspective.
So on the alternative modeling assumption side, if you notice here, our damage function here is based on proportion. So, how much of my property value do I lose, normalized. But you could actually denormalize this to get the maximum damage per square meter of the building. So if you have that information available, you know how big your floor space is, then you could get a more accurate estimate here.
You can also account for the undamagable part of the building, depending on what it's made out of. So, for example, if it's made out of concrete, then you assume about 40% of it is undamagable. If it's made out of wood, it's a garden shed somewhere, then it will probably be swept away quite easily. So it doesn't have any undamagable portion.
And finally, you could make different assumptions about your building content values. So for many of these, this includes some of the content values. So, for example, I think residential buildings assume content value of half of what the property itself is worth. And this is included in that. But you might decide that's not appropriate and want to change this.
As far as incorporating additional data goes, for this example, we incorporated additional data from the GASPAR API, and also from BRGM, which you can see over here. So both of these are freely available, flooding information available in France.
The one on the left is very simple. It just tells you low, medium, high and it's not very granular, unfortunately. The one on the right is much more granular and also much more detailed. So this, for example, tells you about different kinds of flooding and the certainty with which this map is presented to you.
So if you do have access to data like this, this is data that you trust, then you can use this to calibrate your damages equation-- for example, by multiplying in an additional coefficient over here to calibrate it. So we went through multiple iterations of that with this customer until they were happy with the final damages that we predicted for their mortgage portfolio.
So we've talked about transparency and a little bit on the customizability side for our first example. So let's carry on to the second one, to motivate our remaining properties.
Right. So, as before, we start with the risk triangle. Our exposure is going to be very similar. We need some property addresses, some property values. And again, this could be any assets for which you can have a latitude and a longitude. Here, we're also going to need the distance to the sea.
From the hazard data, we're going to need information like the path of the tropical cyclone, the average wind speed, time and pressure information, and so on. And our vulnerability is going to be a damage function quite similar to before.
Our asset data again is a table of lat/longs. Here we have additional distance to sea properties, which you can see on the right here. And that's relatively simple to compute. You can get publicly available shape data and then just compute the distance to the nearest coastline using our Mapping Toolbox.
So in this case, our input data for the hazard is a synthetic tropical cyclone database. And you can see this visualized here. So each one of these little lines is a path of a simulated tropical cyclone, and the color is the maximum wind speed along the path.
So, tropical cyclones are quite rare, which is good for us. But it does mean that we don't have a lot of data on it. And usually they affect quite a small stretch of the coastline, like less than 500 kilometers. And so reliable data sets are only available from about 1980 onwards, meaning that for many coastal regions where we do care about hurricane risk, there might not even be a single land-falling cyclone in the available data sets, which makes it hard to do reliable risk assessments.
But one way to overcome this issue is to extend the historical record. So, basically, you simulate some tropical cyclones over a much longer period of time. So these tropical cyclone tracks and intensities are statistically resampled and modeled from an underlying data set of historical data. Well, it could be historical or it could be meteorological. In this case, it's historical.
And you can repeat this over and over to create a much larger data set. And you can think of this kind of doing Monte Carlo, where each sample is a year's worth of hurricanes. And crucially, this gives us enough data for us to be able to do risk assessments.
So what it gives us, in addition to the path and maximum wind speed that we just saw, we also have some other information. So for example, we have the radius of the tropical cyclone and the radius at which it achieves the maximum velocity. And over to the left there, you can see a distribution of maximum wind speeds in Florida, which is where our example takes place.
So our damage function, our vulnerability component, looks nice and simple. It looks kind of like the ones we saw before. It goes from 0 to a number near 1.
And it's got these two parameters that you can see on the left there. The one is called the threshold. And that is the velocity at which your property first starts to take damage. And then you have the half, which is the threshold at which half of your property value is lost due to wind damage.
Now, you might notice that we also have a V in there, which is the velocity of the wind where your property is. And while it looks a little bit-- it looks quite nice and inconspicuous, but that's actually quite tricky. We don't have the velocity at all points in the hurricane all the time-- at least not straight from the data set.
What we need to do is have a function that's going to describe the wind speed using only the inputs we have available, which is how we end up with this much less friendly looking equation up there. So this one takes Rm and Vm, which is our maximum radius and the maximum velocity-- rather, the maximum velocity and the radius at which that is achieved.
But it also takes a number of other things. For example, we've got this Ti, which is the angle between the direction of the hurricane and your property, and then many other factors over there. Some of them can just kind of be constants or coefficients depending on where your property is.
But some of them, like, for example, the wind-speed profile parameter, needs you to read a whole different paper and solve a whole different set of equations to arrive at a good value. And so you see that this kind of modeling can actually get quite tricky. You need to spend a lot of time in literature reading up about it, or work with people who already have invested that time, like our team, if you want to avoid tripping up over kind of small issues like this-- well, or larger issues. And doing that, we can then compute the maximum wind speed experienced by each one of our properties in our toy portfolio.
So, on to the numbers. So this example looks at some properties in Florida. Again, this is based on a real use case for one of our customers in the US. But this is just a toy portfolio. This is not their portfolio.
And we can see that here we have the simulated loss for all the properties. We've put it on a log scale there to make it easier to interpret. And you can see that in 72% of the simulations, none of the properties really take very much damage. But in the worst 5% there, the combined yearly losses exceed about $14,000 and get quite substantial in the tails.
We could, of course, make similar plots to the ones we did for the flood risk example, if our properties are a portfolio of mortgages. But we've already seen that sort of thing. So what can be useful to do instead is consider our relative risk.
So for example, if you're making decisions about where to invest your money in the future-- should I buy a property in Miami or should I buy one in Orlando? And if you look at a plot like this one, where we've taken the worst 5% of losses for each property, and then scale them so that the properties with lower losses are green and the higher losses are red, then you can see that maybe Orlando is a safer bet than Miami or Tampa.
So with all of that information in mind about the tropical cyclones, let's get back to our discussion on what we want from a good risk solution. So we've covered transparency and a little bit about customizability. But there are a few more things here that we can say in the context of the tropical cyclones.
So, for example, the relevance of perils and transition risks differ. And you might have a varying appetite for uncertainty depending on exactly the application you have in mind.
So, on the relevance of perils differing, for example, if you are in the North Indian Basin, on the top left there, then you're probably a lot less worried about tropical cyclones than someone in the Eastern Pacific Basin or the Western Pacific Basin. So that's not very surprising.
Another thing that we found is that our customers have varying risk appetites. So, for example, what tropical cyclones are going to do in the future is still mostly uncertain. The general consensus seems to be that they will decrease in frequency and increase in intensity.
And here I've got some plots from a paper by Knutson, et al. So on the left there you can see some simulated tropical cyclones. So they have to meet some threshold for being large enough to show up on this plot. And the little grid color indicates the number of days over a 20-year period in which a storm was within that point in the grid.
And at the top, we've got present day. In the middle, we've got a middle of the road climate scenario in the late 21st century, projected. And at the bottom, we can see the difference.
So here you can see that for some places, the frequency decreases. So that would be somewhere in the Western Pacific Basin. But in the Eastern Pacific Basin, we have an increase in frequency-- at least predicted by this model.
And for intensity, this figure shows the tracks for simulated tropical storms again, for the present day versus RCP 4.5. And we can see that we've got comparatively more Category 4 and 5 storms projected for the late 21st century versus now. And I've just highlighted over there, those are the areas where we're having the higher-intensity storms.
So some of our customers are happy to say, well, this is what the research is currently showing. So it would be useful for us to maybe incorporate these projections into the risk assessments that we do. Some of our other customers are saying, well, we don't how much we trust this. Maybe what we want instead is a way for us to be able to change the expected intensity and frequency and kind of build our own scenarios that we can hedge against. And still other customers are saying, well, we don't want to think about this at all. We're happy just thinking about present-day risk, and we don't want to have to justify anything more than that to our investors.
And all of that is fine. But for all of that, you need the ability to make that decision. You need to be able to make an informed decision.
So on the scalability side, you want to be able to parallelize both in terms of the number of simulations. So if I just click through some years of simulations here, here we've got 1,000 years of simulations. This will grow with portfolio size, and as you project forward in time.
And finally, on the business side, you want your analysis to be repeatable. You want to be able to generate potentially different reports for different stakeholders and output for other downstream processes.
Right. So we've seen transparency, customizability, and scalability. And for all of these, our climate risk solutions are built on the back of our core computational finance products, our mapping and geoscience capabilities, and leverage our pre-built APIs for common climate data sets and scenarios.
So if you have a use case in this area, we would love to hear from you. We have a consulting team that specializes in getting this sort of thing up and running. So yeah, please do reach out.