How to Turn Your Script into a Simple App - MATLAB
Video Player is loading.
Current Time 0:00
Duration 20:42
Loaded: 0.00%
Stream Type LIVE
Remaining Time 20:42
 
1x
  • Chapters
  • descriptions off, selected
  • en (Main), selected
    Video length is 20:42

    How to Turn Your Script into a Simple App

    Custom-built apps are a great way to teach a concept, to automate common tasks, or to provide dashboards for interactively exploring complex data sets. And now with interactive controls in the Live Editor, if you can write a script, you can write an app. This video demonstrates how to convert MATLAB scripts into simple notebook-style apps.

    Published: 25 May 2022

    [MATLAB EXPO SOUND LOGO]

    Hey, and welcome. Have you ever written a script in MATLAB that you tried to share with your coworkers, colleagues, other researchers and found yourself writing a long email or a whole bunch of comments that says, oh, if you want to play around, you can go find this variable in here somewhere and then change its values? But, oh, make sure it's not too small or too big because then it might break? And then here's another variable that you can get too late?

    If so, you're in the right place. My name's Michelle. I lead the MATLAB Product Management and Product Marketing teams. I'm here to talk with you about how to turn your script into a simple app. So what do I mean? I mean quite literally, we're going to take this script over here on the left and turn it over the next 20 minutes into this simple app over here on the right.

    Let's take a look at the app. So I call it the Sea Surface Temperature Explorer. It's based on a script that I wrote using the Climate Data Toolbox. This is a Toolbox authored by some climate science researchers that I downloaded from the File Exchange and MATLAB Central. Helps me understand global warming trends by looking at sea surface temperature.

    First, we see a plot here of the sea surface temperature in the Pacific Ocean with an animation that I can play and see how it's changed year over year over year. A little bit farther below, I can see the trend. So it's that same map, but instead of seeing the absolute temperature, we see what's the annualized trend? Has it been increasing on average or decreasing on average year over year?

    With the additional ability to show, which of these trends are believed to be statistically significant? Unfortunately, we see it's the warming trends that we believe are accurate measurements. And the cooling trends, maybe not so. And then finally, we have the ability to click on a different location in this plot, in this map and then drill down and see the entire measured sea surface temperature history at that location along with the trend line mapped. here.

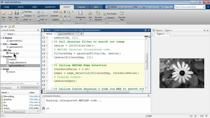
    So it looks like fun. Seem interesting. Let's dig in and show you how I did it. So I started with this script right here, again, based on an example from the Climate Data Toolbox. And the first thing I do is I select a script in the current folder browser. Just right-click and say, open it as a live script. This opens it up in what's called the Live Editor, which is another version of the MATLAB Editor. I think of is just the notebook environment for MATLAB.

    It allows me to work with formatted text. I can write anything. I can select text and make it bold and italics, those kinds of things. I can insert images. Let's see. Let's insert a table of contents, or, of course, write my code. It is a programming environment too, though, not just a document. So each section of code, I just click on a bar and run that section.

    If I just compare these two, you'll see the way MATLAB just automatically interpreted the way I wrote my comments on the left, turned it into this document on the right. So this temperature trends here is a heading here. There are some text, some code. You get the idea. Let's give it the script. We're not going to need that anymore.

    All right. So we saw that we can run a section by just clicking on the bar. If that section generates any output, such as variables displayed at the command window or plots, those get included right here in place. So it's really great when you want to iterate on the values of parameters. Like, let's say we want to look at the sea surface temperature in 1980. Change the year. Run that section again and see the updated plot.

    So in terms of trying to get something that's easier for our colleagues to work with, I think we've actually made a really good step. This is a much friendlier document than looking at somebody's program. There's code here, but also storytelling. I can say what I want to say. And I have the ability to iterate easily and see the output right here in one place.

    But now is where the fun begins. So I'm still in the same situation that I outlined at the opening of the talk. That if I want to tell them to update the year, I'm writing comments and all these kinds of things to try to point them to the right place and document. Let's make that easier. I just simply select the year and introduce a control.

    So here, we will replace the numeric value of year with a slider that when I move it, it will run this section of code. One more change I want to make, which is to configure the slider so that I set the limits to only reasonable ranges of my data. We'll say, go from 1980 to, we'll say 2015. And this is just based on I know about where my data has been measured. So I know what I've got.

    And so let's check this out. Now, when I move the slider, runs the code and gives me the updated result. So making it easier for my coworkers to come in and figure out what to edit and how to edit it in a way that works well. Doesn't break the code. Now, I'll say that when I start showing this to other MATLAB users, people tend to freak out a little bit.

    They're like, you're putting this thing, this control in the middle of my code. I just want to make the point that these are really just code. I can comment them out. I can delete them and get back to the literal value. I can use undo. And undo even works with the changes in the value. It's really just a coupling to that value that was right there. Let's look a little further down, because there's something else I'd like to give my users control over.

    So we've got this section here, where we do the analysis on the temperature trends. And then we produce that map. Remember that map had those little dots showing statistical significance. That's called a stipple plot. And I'd like to have it there, because it helps you understand what's going on. But it can be a little bit noisy. So I'd like my users, my coworkers to be able to turn that on and off.

    I have a variable here that they can just change to false and rerun the section. But again, this involves them getting it to my code, understanding how it works, knowing what the variables do. So instead, we'll just replace it with an interactive control. Because this is just true/false, a checkbox is a perfect alternative.

    So check it, and it's on. And we get the dots. Check it again, and it's off. We don't get the dots. So we're starting to get somewhere. We've added a couple of controls, configured them just a little bit. But this still doesn't look anything like an app, really. It just looks like code with some text and with some controls in it.

    Easy enough, there's an option over here in the right to hide the code. Nothing's gone away-- we just can't see it. So now, we have this view that's just the document part and the output and the input controls. One thing we see here is that the label for the control just came automatically from the name of my variable in the file.

    Sometimes that's good. Not so much here. So we'll just configure that to say something useful like, Show statistical significance. OK. Now, we're really getting somewhere. Let's add a little bit more flexibility to our simple app or mark up our script. So here, I've set this up to work with a single-data file. But I know it works with some other ones.

    Here's a name of some other files that I've got floating around that I know it works with. You guys are getting the hang of this now, right? Select the value we want to change and find the control to replace it. One thing you might notice is that every time I go to this menu, MATLAB gives me some choices and the others are disabled.

    That's because it's looking at the type of values that I've selected and only given me controls that makes sense. In this case, it's text. And the two controls here that would work for text are a dropdown menu you pick from a list or an edit field, where you just type in a value. So make that a dropdown. We right-click and configure.

    And then I just simply paste in those values that I just copied. Now, there's one other change I want to make. The other controls we've looked at so far, when I run them, they just ran that one section of code. But if somebody loads a new data file, I need to run the whole rest of the file. Because all of the plots after it aren't relevant.

    They're for the old data file we had looked at. That's easy enough to configure with the section down here at the bottom. Well, we'll just say, run all sections whenever I interact with this control. And so now you'll see I've got the ability to say, pick a new location. We'll say North Atlantic. Hide the code. And it picks that new location. Reruns, updates the entire file.

    So that's not bad. We're only a few minutes in, and we've taken our script, traditional MATLAB program, turned it into this live script, this notebook, that tells a story that's more accessible. We've replaced values with interactive controls. And we've hidden our code so that our coworkers know exactly where to go, what to do, and how to work with this.

    Now, I want to start pushing things a little bit harder, taking advantage of some more advanced functionality to build a more robust and more flexible simple app. So let's come back to those data files. I hard-coded a list of three files. Well, I actually have a bunch more than that. If we look over here on the side, I have a whole bunch of files in a data folder.

    And I want to tell my coworkers, just plop your data files in that folder. And we'll pick them up automatically. So let me show you how I do that, I'm going to create a new variable called files. And I'm using a function I wrote, a very simple function that simply lists the data files. Let me run it to show you what I mean. It gives me a string with the name of all the data files in that folder.

    And so we want to figure out how to do is to get this control to use that list instead of the ones I typed in. So we'll configure it. And instead of typing in the values here, we just go a little bit farther down to where it's a selective variable to add its contents to the dropdown. And so now, whenever I run this program, it'll look in that folder, pick up the list of data files, and then populate this with that whole list of files.

    This brings up another change now as we start to make this a little more flexible. My data files are recorded over different time periods. I have some locations around the Earth that I have data back to the 1800s. Others maybe doesn't start until around 1980 or so. So we'd like this year control to be based on the specific data that my coworker loaded.

    And so we'll take the same basic approach. We'll configure the control. And in this case, we want to set the smallest value, the minimum up to-- I haven't done the work yet, sorry. I'm going to create a couple of new variables, first year and last year that represent the first and last years of my data. And we'll do that by simply computing the bounds, the lower and upper limits of the year of my time signal.

    So let's run those and see what I've got. For this data, first year is 1982. Last year's 2022. We have data right up till today. Now, configure this control. Set the minimum to be based on first year, the maximum to be based on last year. And we'll set the default to also be last year. Hide the code and see what we've got.

    And you'll notice as I move the slider or mouse over that it's setting the ranges specific to this data value. So we're getting a little bit fancier here. Still working within the main line, and just linking the values of these controls to variables that are in our script. So we can make something more dynamic. Now, I want to push on the two more advanced things I showed at the beginning.

    The first one was the ability to click on this plot and then run this section down here below to update the time history plot based on the location selected here. So that's I click here, and then I want to be able to run the section below. First, how did I click there? How did that work? Well, I program what's called a custom button down function for my graphics object.

    So this is in the plotting function that I used to create this plot here. And it's a little bit of advanced coding, I'll say. Nothing new. It's capabilities that have been in MATLAB for over 20 years. Now, every time I click on this plot, my button down function does two things. It moves the start, and it changes the value of these two variables, latitude and longitude.

    Let's see if-- watch that happen. If you're paying close attention, when I click, you see latitude and longitude uptake. And so now, what I'd like to do simply is give my user the ability to run this next section after they click on the plot. For that, I'll introduce the easiest possible control. It's just a button that says, run this section. We'll say, Update time history plot.

    And so now, I can click here to, pick a new location and then say, update the plot. Not bad. So again, maybe what's it been? 10, 15 minutes or so. We've already built ourselves a pretty nice simple app. The one thing I haven't shown you yet is that animation that we started with at the very beginning. I'm going to open up a file I wrote that's just extracting the code just to look at how the animation works.

    So at the same basic thing we've been seeing for that first plot. Load some data and make a plot. The big difference is I'm plotting inside of a loop. MATLAB and the Live Editor automatically generates an animation when you create or update a plot. As long as it updates at least about eight or nine times or so, there's some little black magic behind the scenes, and as you do something to make sure that drawing happens.

    I did that by just adding a little pause command here, which just forces MATLAB to say, oh OK, there's a plot there. Let's make sure we capture that. And now I get that animation, otherwise, effectively for free. The ability to change the speed, ability to jump around to any bit, which I find really useful if I have a long running calculation. Because I could do it once, but then I can really take time to slice through the results and even to export the animation as a movie file.

    And so that's the basics of what I wanted to cover today. And so let's come back to that original script. I think we've done pretty well here. We took our simple maps script. We imported it into the Live Editor as a live script, this notebook view. We replaced the literal values of variables in the code with these interactive controls. We configured them. Got a little bit more advanced and configured them to be dynamically linked to variables.

    We programmed, which I didn't really show you, a custom button down function. And we saw how the Live Editor would automatically generate animations for us. Now, there's one more topic I'd like to touch on. And I'll say it's a bit controversial. It was a fair bit controversial for me at work with my coworkers at MathWorks to call this thing I just built an app.

    They say, Michelle, you've been telling us for 10 years what an app is in MATLAB. We get to them from the Apps tab at the desktop. And they're right, I have been telling them that for 10 years. The Apps tab has this gallery of all these apps that come with MATLAB and its add-on products like the new Data Cleaner that just came out, or the Classification Learner, a really popular machine learning app.

    Apps tab also has apps that I've written, my coworkers have written, and that I've downloaded from the File Exchange MATLAB Central. So I want to talk about these apps and how they relate to the simple app I just showed based on the Live Editor. So here's what I built conveniently enough called the Sea Surface Temperature Explorer. It's the same thing we just looked at, but in a more traditional app form.

    It's running in a MATLAB figure window. It's got the same basic capabilities. It's a little bit more performant, a little more responsive, just the way I coded it. And you see I linked the two plots. So when I moved the star around, it updates in both and updates the thing down below. Also has nice resize behavior. So as I put it different ways, it manages all the layout. So more advanced stuff.

    So I built this using a tool in MATLAB called App Designer. And that's what we're seeing here. So here, we see the layout of that app in App Designer. App Designer lets you drag and drop to interactively layout and design your app and then gives you the structure for the code of how the app behaves that you then implement yourself.

    So here, you see kind of the skeleton of our app. And I have the ability to just take additional controls and drop them in as I want. Now, you see what the App Designer is. It lets me build a traditional feeling apps, desktop apps. Lets me share them with other people who aren't even MATLAB users. Because not only is the code hidden, but I have the ability to share them as desktop applications and even standalone web applications.

    And it just gives me a lot more flexibility in my programming. The trade off is that it takes more work and more skill. So I'm pretty good at MATLAB. I've been hanging around MATLAB for quite a while. You do need to be comfortable writing little functions and passing data around between them. And it takes some time sometimes to get the behavior exactly as you want. So it's a trade-off. You have a couple of choices here.

    So here's the advice I always give. If what you want to do is take your script and make it easier for your coworkers to work with and so they don't have to get into the details of your code, start with the Live Editor and just add those interactive controls. If instead you really want to design an app, you're picturing a figure window, a window full of all kinds of controls and all kinds of custom behavior, definitely take a look at App Designer.

    If you aren't sure, can't hurt to start with a Live Editor. It's really easy to get started to just add those controls into your code. And see where that gets you. If it works for what you need, that's great. If you need more, then you know that App Designer is there, and that you can turn to it. All right, we have covered I think a lot of ground in something like 20 minutes, maybe even less. Let's just wrap up with my slides.

    You see this is as close as I'm coming to PowerPoint today is a picture of PowerPoint. But let's just make sure I've covered everything I wanted to cover today. So we talked about the Live Editor, the notebook environment for MATLAB, and those artifacts that we created are called live scripts. We can do that "what you see is what you get" editing, inserting pictures and formatted text along with our code and the code output.

    We replace the values of the variables in our code with interactive controls. We customize those controls to link to the variables. We saw how the Live Editor automatically generates an animation if you update a plot in a loop. We touched briefly on the ability to create custom interactive graphics with a button down function. And then I gave a little bit of advice on how to think about the Live Editor relative to App Designer.

    Thanks so much. I hope you have learned something. And I really look forward to me or some of my coworkers fielding as many of your questions as we have time for. I do want to point out that we will be sharing all of the code that I showed today from my Git-- where you can download it from my GitHub repository. Thanks.