Analyzing Data with MATLAB
From the series: Data Science Tutorial
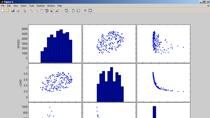
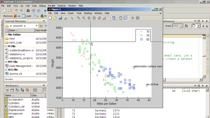
Learn several common ways to analyze data in MATLAB®. This video outlines, step by step, how to perform analysis by group and how to do change point detection.
This video uses weather data to demonstrates how to use prebuilt MATLAB functions to group data by time or location. It also shows how to use functions like islocalmin
and islocalmax
to find the changepoints in your data.
Published: 4 Sep 2019
Related Products
Learn More
Select a Web Site
Choose a web site to get translated content where available and see local events and offers. Based on your location, we recommend that you select: .
You can also select a web site from the following list
How to Get Best Site Performance
Select the China site (in Chinese or English) for best site performance. Other MathWorks country sites are not optimized for visits from your location.
Americas
- América Latina (Español)
- Canada (English)
- United States (English)
Europe
- Belgium (English)
- Denmark (English)
- Deutschland (Deutsch)
- España (Español)
- Finland (English)
- France (Français)
- Ireland (English)
- Italia (Italiano)
- Luxembourg (English)
- Netherlands (English)
- Norway (English)
- Österreich (Deutsch)
- Portugal (English)
- Sweden (English)
- Switzerland
- United Kingdom (English)
Asia Pacific
- Australia (English)
- India (English)
- New Zealand (English)
- 中国
- 日本Japanese (日本語)
- 한국Korean (한국어)