3,725 results

This program aligns depth maps with their color images for Image Based rendering applications
. This program is a basic code that implements a Joint Bilateral filter to align color images with the depth maps. The performance of the code depends on the key performance parameters that are identified
A notable use case is to simulate RGB or Kinect (depth) camera images for computer vision applications.
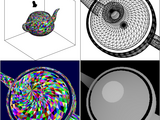
3D Rendering Toolbox: Color images and depth maps from 3D meshesImplementation of the computer graphics pipeline for triangulated meshes, in addition to a number of camera plotting functions. Handles

The complete palette of ColorBrewer 2.0 colormaps. Simple selection by scheme name and map length.
BREWERMAP provides all ColorBrewer 2.0 colorschemes for MATLAB, with simple selection by colormap length and colorscheme name. Alternatively the colorscheme name can be preselected, after which only

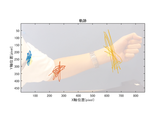
User draws region and this finds pixels in the image with a similar color, using Delta E.
Demo to perform very, very simple color detection in LAB color space. The RGB image is converted to LAB color space and then the user draws some freehand-drawn irregularly shaped region to identify a

RGB to color name. Color name to RGB. Supports many palettes: CSS, dvips, HTML, MATLAB, RAL, SVG, X11, xcolor, xkcd,...
One function converts between RGB and color names, in both directions.The function COLORNAMES accepts either RGB values or color names as its inputs, and returns the color names and RGB values from
RGB triplets for 949 colors, by how they're perceived on a computer monitor and their common names.
This function returns the RGB triplet for almost any color. And unlike the way colors are somewhat officially defined (http://en.wikipedia.org/wiki/Web_colors), this data set describes returns

The frequency image is where the pixel intensity represents the frequency of the same color pixels.
This is a MATLAB implementation of the Color Frequency concept introduced by T. Kashiwagi & S. Oe.With this script, you pick a color image and then it computes the color frequency image. The
Detect colored regions in an image via thresholding in HSV color space.
This script is a demo that shows you how to find objects of a certain color in an image. For this example I'm using the standard onion, peppers, or kids image that ships with the Image Processing

Displays sprintf-formatted strings in the Command Window using the specified color/underline/bold style
cprintf command.STYLE colors can be specified in 3 variants: [0.1, 0.7, 0.3] - standard Matlab RGB color format in the range 0.0-1.0 [26, 178, 76] - numeric RGB values in the range 0-255 '#1ab34d

Fast edges of a color image (actual color, not converting to grayscale)
Version 1.1.0.0
Joao HenriquesEdges of a color image by the max gradient method.
Extracts the edges of a color image without converting it to grayscale.Changes in color are detected even when the grayscale color of two pixels are the same. The edge strength is typically greater

Matlab code to plot color histograms and color clouds
Usage: createColorHistograms(im_str)im_str can be an image file location or a three-dimensional arrayThere seem to be two confounds in plotting color histograms. One is the obvious one of showing a

A GUI to align input and output ports to their connected subsystems
This is a small tool to help in model editing in Simulink.The tool allows to automatically align input and output ports connected to subsystems. The conditions are that the system port is not

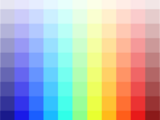
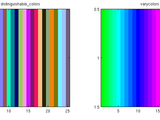
Generate maximally-distinct colors in an RGB colormap.
(double/single) used for the RGB calculations.Specify the bit/color depth to control the number of samples of each color channel.Sort the colormap (e.g. by hue, chroma, saturation, lightness, farthest colors
This program accepts a color and a depth video and converts them to stereoscopic views
Color image and a corresponding per-pixel depth map is one method of 3D video representation. Based on DIBR, this program performs stereoscopic view generation. The depth maps are interpreted

Returns a Matlab RGB color specifier corresponding to a given color name (139 colors supported).
RGB = RGB('COLORNAME') returns the red-green-blue triple corresponding to the color named COLORNAME by the CSS3 proposed standard [1], which contains 139 different colors (an rgb triple is a 1x3
Create tints of colors and colormaps
Create specified tints of colors and colormaps or show examples of tints.To create shades, see http://www.mathworks.com/matlabcentral/fileexchange/47245-color-shades

Automatically align equal sign in variables assignment
This function allows you to align equal signs in the matlab editor.Select some text with variables assignments from the editor and run the function.You may find easier to add this function as a

Creates point clouds from color and depth (RGB-D) images provided by the camera's intrinsic parameters. Also, writes the point cloud file.
# Introduction[![View Color and depth (RGB-D) images to point cloud on File
Generate low-noise extended depth-of-field image from focus sequence
This function generates an extended depth-of-field image (also referred to as all-in-focus image) from a focus sequence using the noise-robust selective all-in-focus algorithm [1]. Input images may

Create color maps from actual names that people use for colors.
viewers more than 900 of the most commonly-used colors on the internet, and getting users to use their own words to describe that color. The result is a database of the most commonly-used names for colors

This program just tracks all red color objects and draws a bounding box around them.
This program just tracks all red color objects and draws a bounding box around them. This works on the difference between frames concept. Every frame in the video is returned as an rgb image on which

Script to do simple color detection in RGB color space. Finds red objects in the image.
This script is a demo that shows you how to find objects of a certain color in an image. For this example I'm using the standard onion, peppers, or canoe image that ships with the Image Processing
Color Tools for MATLAB is an experimental collection of MATLAB functions related to color science computation and visualization.
Color Tools for MATLAB is an experimental collection of MATLAB functions related to color science computation, color scales, visualization, and ICC color profiles. It is meant to supplement the
Bowtie aligns short DNA sequences to a reference genome.
Bowtie is an ultrafast, memory-efficient short read aligner. It aligns short DNA sequences (reads) to the human genome at a rate of over 25 million 35-bp reads per hour. Bowtie indexes the genome
Create and apply GMT-style colormaps in Matlab
## cptcmap.m DocumentationAuthor: Kelly Kearney[
Converts a gray image to color image
This program converts a gray image to color image. The conversion is based on color image submitted along with the input gray image. Actualy it transfers color to a grayscale image. The
This function will help to determine mixed layer depth
; sw_smow.m% % DESCRIPTION: This function determines Mixed Layer Depth (MLD) from profile data% sets based on subjective method. If you have 3D data sets i.e. level, lat and lon and want % to compute the MLD
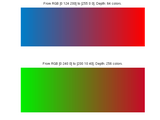
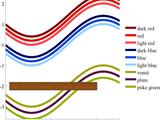
COLORGRADIENT allows you to generate a linear color gradient from color A to color B.
User can generate a custom linear colormap giving 2 colors and colormap depth.Colors are given as vectors with RGB values. The suggested input method is using intensity values for each channel (0,1

Align axis labels nicely in parallel with axes in MATLAB (3-D) plots.
This is a simple MATLAB function for axis label alignment. It still works when Projection mode is Perspective or when DataAspectRatio is not [1 1 1].## Functions- `align_axislabel`: it rotates $x

Helps to align the simulink model blocks using directed graph algorithms.
BlockAlignment - Simulink Block Alignment ToolHelps to align the simulink model blocks using directed graph algorithms.Syntax:>> autoBlockAlignment(modelLayer,alignDepth

Colour toolbox that accompanies the second edition of Computational Colour Science using MATLAB
Colour toolbox that accompanies the second edition of Computational Colour Science using MATLAB (Westland, Ripamonti and Cheung, 2012).Toolbox allows spectral interpolation, calculation of colour
Efficient identification of color names for any RGB
Yes, its easy to identify [1, 0, 0] as a red color. But sometimes we want to find ALL colors in an image that we would identify as red. Thus, [1, 0.1, 0.1] is also easily seen as red by the eye. Its

MATLAB Volume depthVolumeColorCoder
MATLAB-Volume-depthVolumeColorCoderMATLAB Volume depthVolumeColorCoderBriefly, the function creates a color coded depth using the specified colormap along thez-axis. This is, the bottom of the volume
Choose a set of n colors that can be readily distinguished from each other
When plotting a set of lines, you may want to distinguish them by color. By default, Matlab chooses a small set of colors and cycles among them, and so if you have more than a few lines there will be

Fills in '0' depth value in kinect depth image with statistical mode of surrounding 25 values
The kinect depth image has pixels with values equal to the calculated depth of object/surface in view. However, areas that absorb or scatter the kinect IR (like glossy surfaces or sharp edges) are

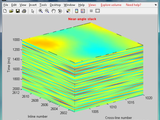
Release 6.1925 of a collection of functions for analysis/display of seismic and well-log data.
plot the attached figure):%Read interactively selected SEG-Y fileseismic = read_segy_file;%Make a color plot of the data reads_cplot(seismic)% Make a wiggle plot on top of the color plot% and

MATLAB Image Manipulation Toolbox
functionality.Let me know if you find bugs. Highlights:GUI extensions of several core functionsPassthrough/fallback replacements for several IPT toolsMulti-model color picker GUIGUI for parametric color-based mask

A function to explain a stereo-like taxonomy to be used in light field depth estimation
This file is provided in conjunction to the submission to STSIVA 2014, please read the paper when available to understand the content: Title ---Depth Map Estimation In Light Fields Using An
Updated code hatch with color and inverted hatches
DFS performs depth first search on graph with source and target vectors.
DFS performs depth first search on graph with source and target vectors.Syntax: [searchNodes,iterations] = dfs(source,target,names,startNode)[searchNodes,iterations] =

This function can be used to create various plots of Lab color coordinates.
The plot_Lab function is a simple tool to create nice-looking Matlab figures of CIE-L*a*b* color coordinates of a set of data samples.Features:-> plots can be created in true-color (each datapoint

Region-based depth-map inpainting
Region-based depth recovery. Takes as input a sparse depth map (with NaN's at the location of missing values) and a guidance segmentation label matrix, and returns the recovered depth map. This is
Label plots with spectra. Convert wavelengths to RGB. Functions for color matching and illuminants.
This is the beginning of a set of functions for working with color as wavelengths (spectral color) and in the xyY and XYZ color spaces.Current functionality includes:spectrumLabel - Add a color bar

Microsoft Kinect, OpenNI wrapper, Skeleton, Depth
.* only depth/video stream support.To compile the code to mex-files use the Microsoft Visual Studio (Express) or MacOS/Linux Gcc (x64/x86) C++ compiler.To use OpenNI version 1.* install:- OpenNI 1.5.4.0

This function merges a stack of images taken at multiple focal planes into an all-in-focus image.
dataset, parameter has to be tuned carefully. Input must be a cell array of images taken at different focal planes, with each cell containing a single color or grayscale image.

Easily customize MATLAB’s color settings by selecting and applying color schemes from MATLAB Color Theme Extensions.
# MATLAB Color Theme Extensions[
Align two time-stamped data streams in time
TIMEALIGN Align 2 data matrices in time. The presumption is that t1 and t2 vectors are associated with data matrices that must be time aligned. There is no assumption of even time spacing, but

Plot which shows relationship between wavelength, wave period and water depth.
This function gets the nomograph which shows the relationship between the wavelength, wave period and water depth using the dispersion equation.0. Syntax:>> wavelenvsth1. Inputs: None.2
Synthesize a perfect version of the X-Rite Color Checker chart.
The X-Rite Color Checker Chart is a very common standard used for standardizing different images and imaging systems. (This chart has been known in the past as the Gretag Macbeth Color
Several color conversion and graphic tools to play around with
Several color conversion and graphic tools to play around with There are mainly three functionalities1) conversion between color spaces (RGB, HSV, HSL, XYZ, xyY, Lab), here nothing new2) Constructing
A curve evolution approach for unsupervised segmetation of images with low depth of field
Release 10.0301 of a collection of functions for analysis/display of seismic and well-log data.

Generate vertices, faces and color for u3d format and display it in pdf or doc, xls and ppt
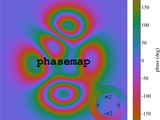
A constant-lightness cyclic colormap for phase.
lightness is good for displaying phase because it does not put strong emphasis on any part of the color map. A well-written and aesthetically-pleasing overview of Kristen's cmocean colormaps can be found
A colormap that attempts to be color blind friendly
This is a .mat file that contains 12 colors specified by Matlab color triplets. The file contains a matrix of colors(each row is 1 color) as well as a matrix of the names for each color. The names
Simulated a semiconductor laser diode subject to feedback
simulate, time of simulation, laser bias current, optical feedback strength, optical feedback delay, etc- current modulation parameters including modulation depth and modulation frequencyReferences:Ryan
Color marker based object tracking for video analysis using Kalman filter
This demo shows a color marker based object tracking for video analysis. You can use a custom color mask function created by using colorThreshoulder app.The tracking performs robustly because missing

Realistic rendering of depth of field in Matlab 3D plots using focal length and aperture size.
Say 'hello' to your brand new Matlab 3D camera. The matlab function aacam.m uses brute force simulation to enable realistic depth of field rendering in 3D plots. It allows you to specify focal length

Plots a 3D line with color encoding along the length using the patch function.
This function plots a 3D line (x,y,z) encoded with scalar color data (c). This function is an improvement over the CLINE function previously made available on TMW File Exchange. Rather than using
You can also select a web site from the following list
Americas
- América Latina (Español)
- Canada (English)
- United States (English)
Europe
- Belgium (English)
- Denmark (English)
- Deutschland (Deutsch)
- España (Español)
- Finland (English)
- France (Français)
- Ireland (English)
- Italia (Italiano)
- Luxembourg (English)
- Netherlands (English)
- Norway (English)
- Österreich (Deutsch)
- Portugal (English)
- Sweden (English)
- Switzerland
- United Kingdom(English)
Asia Pacific
- Australia (English)
- India (English)
- New Zealand (English)
- 中国
- 日本Japanese (日本語)
- 한국Korean (한국어)